

Өзекті паттерндер

Двойное дно
сформирован 31.03 в 00:50:23 (UTC+0)
сила сигнала 1 из 5
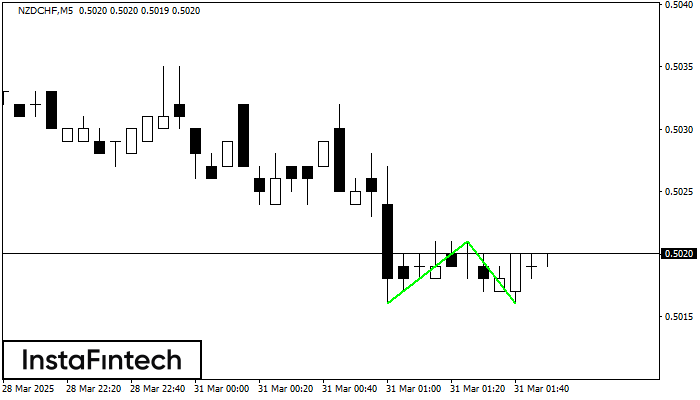
Сформирована фигура «Двойное дно» на графике NZDCHF M5. Верхняя граница 0.5021; Нижняя граница 0.5016; Ширина фигуры 5 пунктов. В случае пробоя верхней границы 0.5021 можно будет прогнозировать изменение тенденции, где ширина фигуры и будет являться расстоянием предположительного Тейк Профита.
Таймфреймы М5 и М15 могут иметь больше ложных точек входа.
Сондай-ақ қараңыз
- Все
- Все
- Bearish Rectangle
- Bearish Symmetrical Triangle
- Bearish Symmetrical Triangle
- Bullish Rectangle
- Double Top
- Double Top
- Triple Bottom
- Triple Bottom
- Triple Top
- Triple Top
- Все
- Все
- Покупка
- Продажа
- Все
- 1
- 2
- 3
- 4
- 5
Double Bottom
was formed on 09.10 at 20:21:00 (UTC+0)
signal strength 1 of 5
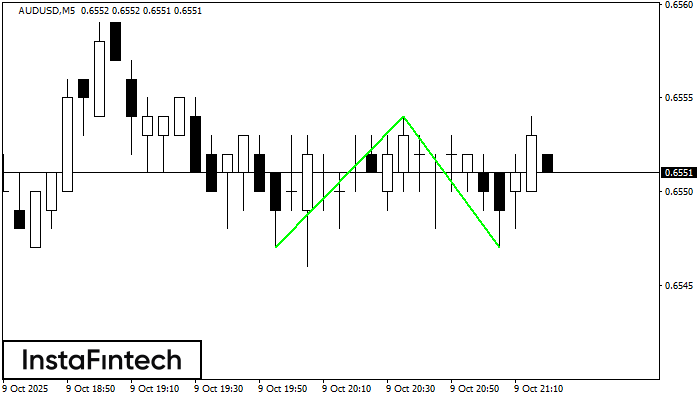
The Double Bottom pattern has been formed on AUDUSD M5. Characteristics: the support level 0.6547; the resistance level 0.6554; the width of the pattern 7 points. If the resistance level
The M5 and M15 time frames may have more false entry points.
Open chart in a new window
Triple Bottom
was formed on 09.10 at 19:30:26 (UTC+0)
signal strength 1 of 5
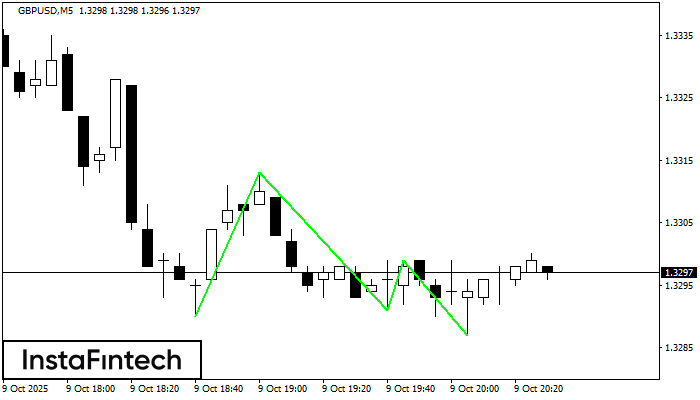
The Triple Bottom pattern has formed on the chart of GBPUSD M5. Features of the pattern: The lower line of the pattern has coordinates 1.3313 with the upper limit 1.3313/1.3299
The M5 and M15 time frames may have more false entry points.
Open chart in a new window
Bearish Flag
was formed on 09.10 at 19:00:30 (UTC+0)
signal strength 3 of 5
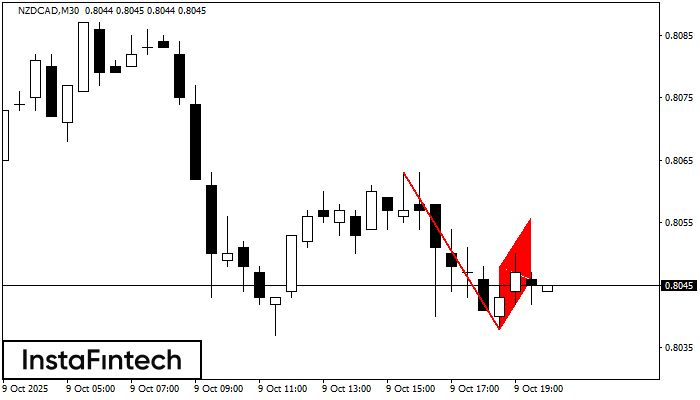
The Bearish Flag pattern has been formed on NZDCAD at M30. The lower boundary of the pattern is located at 0.8038/0.8046 while the upper boundary lies at 0.8048/0.8056. The projection
Open chart in a new window


