

Өзекті паттерндер

Двойное дно
сформирован 26.03 в 08:30:42 (UTC+0)
сила сигнала 3 из 5
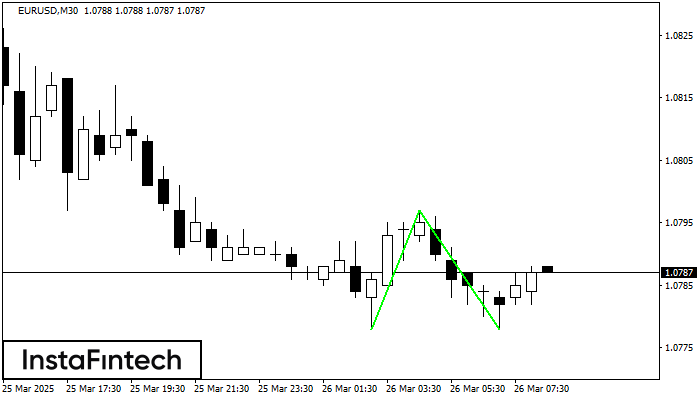
Сформирована фигура «Двойное дно» на графике EURUSD M30. Данное формирование сигнализирует об изменении тенденции с нисходящего на восходящее движение. Сигнал: Торговую позицию на покупку следует открывать после пробоя верхней границы фигуры 1.0797, где перспектива будущего хода будет являться шириной текущей фигуры - 19 пунктов.
- Все
- Все
- Bearish Rectangle
- Bearish Symmetrical Triangle
- Bearish Symmetrical Triangle
- Bullish Rectangle
- Double Top
- Double Top
- Triple Bottom
- Triple Bottom
- Triple Top
- Triple Top
- Все
- Все
- Покупка
- Продажа
- Все
- 1
- 2
- 3
- 4
- 5
Bullish Flag
was formed on 06.06 at 11:25:16 (UTC+0)
signal strength 1 of 5
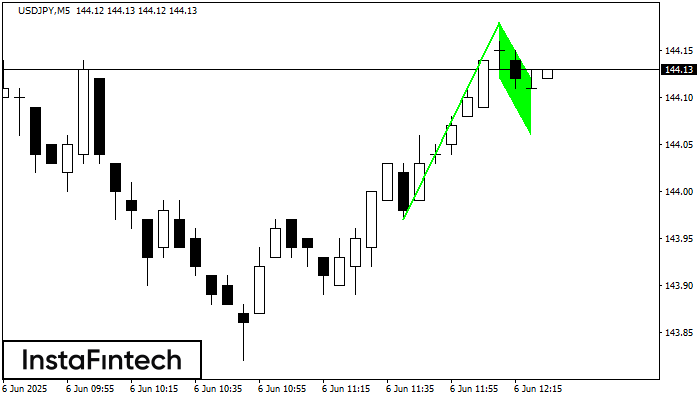
The Bullish Flag pattern which signals continuation of a trend has been formed on the chart USDJPY M5. Forecast: if the price breaks above the pattern high at 144.18, then
The M5 and M15 time frames may have more false entry points.
Open chart in a new window
Bullish pennant
was formed on 06.06 at 11:25:10 (UTC+0)
signal strength 1 of 5
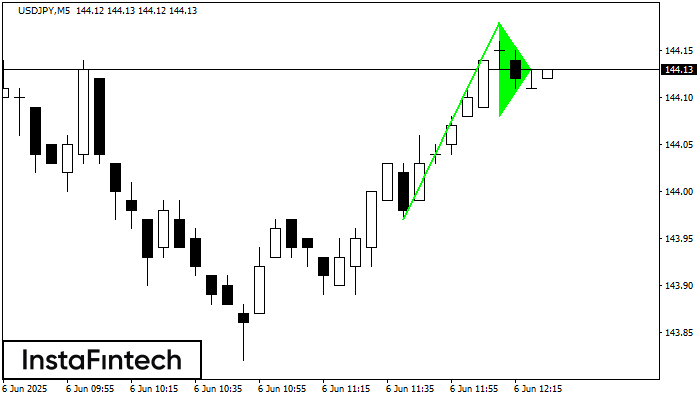
The Bullish pennant signal – Trading instrument USDJPY M5, continuation pattern. Forecast: it is possible to set up a buy position above the pattern’s high of 144.18, with the prospect
The M5 and M15 time frames may have more false entry points.
Open chart in a new window
Double Top
was formed on 06.06 at 11:00:19 (UTC+0)
signal strength 4 of 5
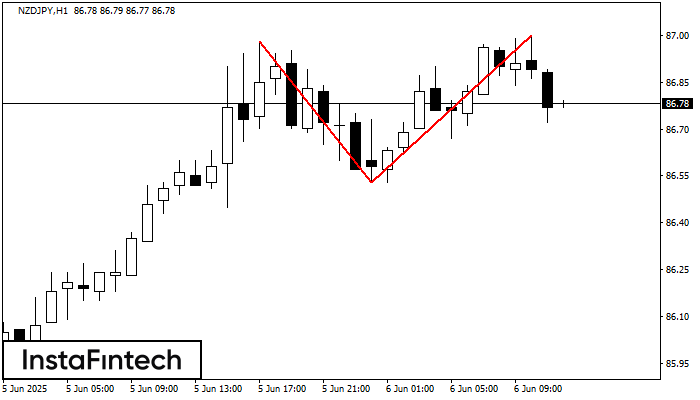
On the chart of NZDJPY H1 the Double Top reversal pattern has been formed. Characteristics: the upper boundary 87.00; the lower boundary 86.53; the width of the pattern 47 points
Open chart in a new window


