

Өзекті паттерндер

Двойное дно
сформирован 26.03 в 05:00:28 (UTC+0)
сила сигнала 4 из 5
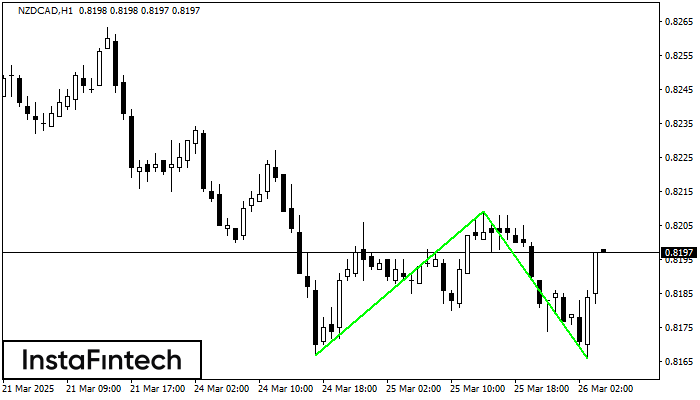
Сформирована фигура «Двойное дно» на графике NZDCAD H1. Верхняя граница 0.8209; Нижняя граница 0.8166; Ширина фигуры 42 пунктов. В случае пробоя верхней границы 0.8209 можно будет прогнозировать изменение тенденции, где ширина фигуры и будет являться расстоянием предположительного Тейк Профита.
Сондай-ақ қараңыз
- Все
- Все
- Bearish Rectangle
- Bearish Symmetrical Triangle
- Bearish Symmetrical Triangle
- Bullish Rectangle
- Double Top
- Double Top
- Triple Bottom
- Triple Bottom
- Triple Top
- Triple Top
- Все
- Все
- Покупка
- Продажа
- Все
- 1
- 2
- 3
- 4
- 5
Double Top
was formed on 03.06 at 09:00:26 (UTC+0)
signal strength 4 of 5
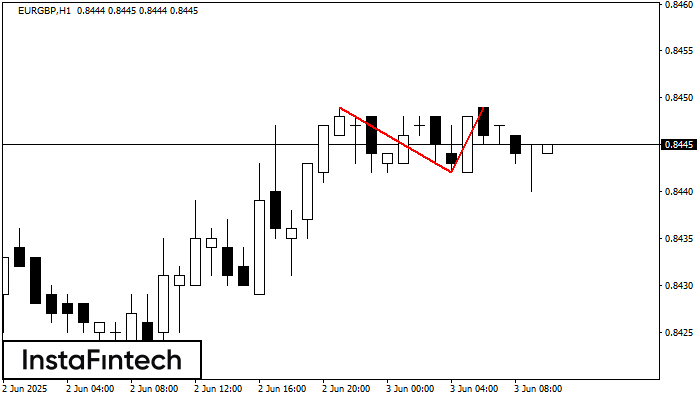
On the chart of EURGBP H1 the Double Top reversal pattern has been formed. Characteristics: the upper boundary 0.8449; the lower boundary 0.8442; the width of the pattern 7 points
Open chart in a new window
Triple Bottom
was formed on 03.06 at 09:00:20 (UTC+0)
signal strength 1 of 5
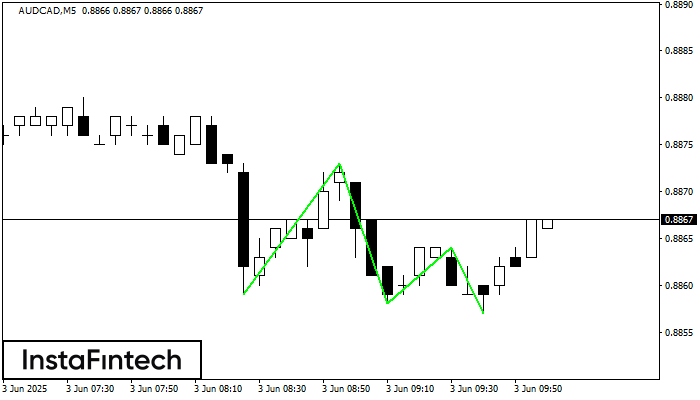
The Triple Bottom pattern has formed on the chart of AUDCAD M5. Features of the pattern: The lower line of the pattern has coordinates 0.8873 with the upper limit 0.8873/0.8864
The M5 and M15 time frames may have more false entry points.
Open chart in a new window
Double Bottom
was formed on 03.06 at 08:45:32 (UTC+0)
signal strength 1 of 5
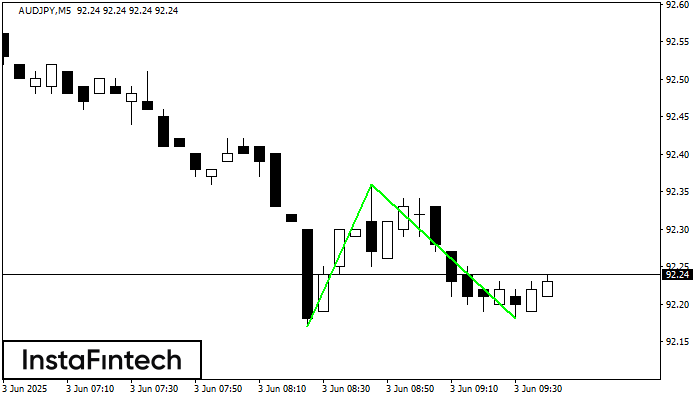
The Double Bottom pattern has been formed on AUDJPY M5. Characteristics: the support level 92.17; the resistance level 92.36; the width of the pattern 19 points. If the resistance level
The M5 and M15 time frames may have more false entry points.
Open chart in a new window


