

Өзекті паттерндер

Медвежий симметричный треугольник
сформирован 25.03 в 21:36:34 (UTC+0)
сила сигнала 3 из 5
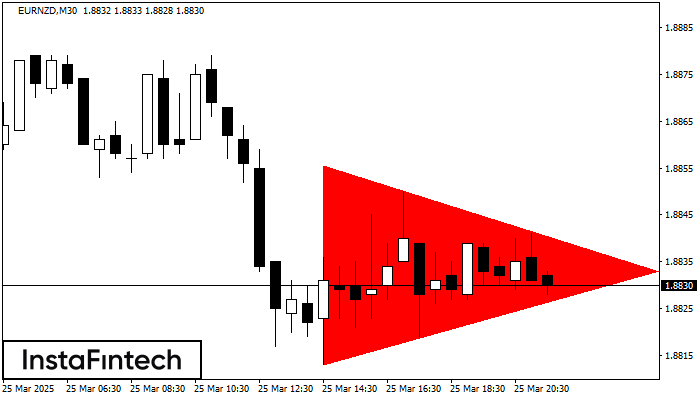
По EURNZD M30 сформировалась фигура «Медвежий симметричный треугольник». Данная фигура сигнализирует нам о продолжении нисходящего тренда в случае пробоя нижней границы 1.8813, где вероятная прибыль будет являться шириной текущей фигуры -43 пунктов.
- Все
- Все
- Bearish Rectangle
- Bearish Symmetrical Triangle
- Bearish Symmetrical Triangle
- Bullish Rectangle
- Double Top
- Double Top
- Triple Bottom
- Triple Bottom
- Triple Top
- Triple Top
- Все
- Все
- Покупка
- Продажа
- Все
- 1
- 2
- 3
- 4
- 5
Triple Top
was formed on 01.06 at 02:15:04 (UTC+0)
signal strength 2 of 5

On the chart of the #Bitcoin M15 trading instrument, the Triple Top pattern that signals a trend change has formed. It is possible that after formation of the third peak
The M5 and M15 time frames may have more false entry points.
Open chart in a new window
Double Top
was formed on 01.06 at 01:00:35 (UTC+0)
signal strength 3 of 5

The Double Top reversal pattern has been formed on #Bitcoin M30. Characteristics: the upper boundary 104800.13; the lower boundary 104215.56; the width of the pattern is 64024 points. Sell trades
Open chart in a new window
Bullish Rectangle
was formed on 31.05 at 19:15:46 (UTC+0)
signal strength 1 of 5

According to the chart of M5, #Bitcoin formed the Bullish Rectangle which is a pattern of a trend continuation. The pattern is contained within the following borders: the lower border
The M5 and M15 time frames may have more false entry points.
Open chart in a new window


