

Өзекті паттерндер

Прямоугольник
сформирован 21.03 в 15:03:03 (UTC+0)
сила сигнала 3 из 5
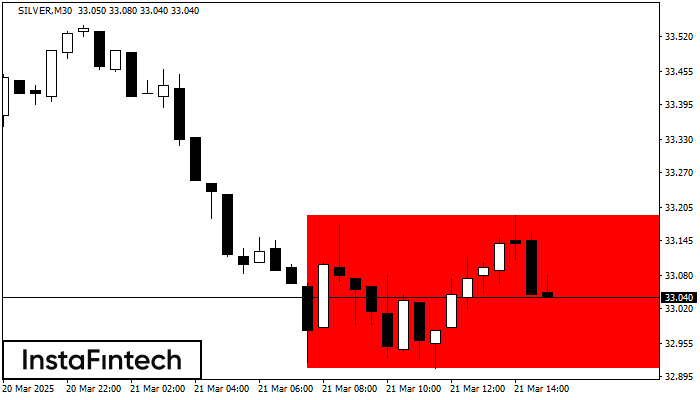
Сформирована фигура «Прямоугольник» на графике SILVER M30. Тип фигуры: Продолжение тренда; Границы: Верхняя 33.19, Нижняя 32.91; Сигнал: позиция на продажу открывается после фиксации цены ниже границы прямоугольника 32.91.
Сондай-ақ қараңыз
- Все
- Все
- Bearish Rectangle
- Bearish Symmetrical Triangle
- Bearish Symmetrical Triangle
- Bullish Rectangle
- Double Top
- Double Top
- Triple Bottom
- Triple Bottom
- Triple Top
- Triple Top
- Все
- Все
- Покупка
- Продажа
- Все
- 1
- 2
- 3
- 4
- 5
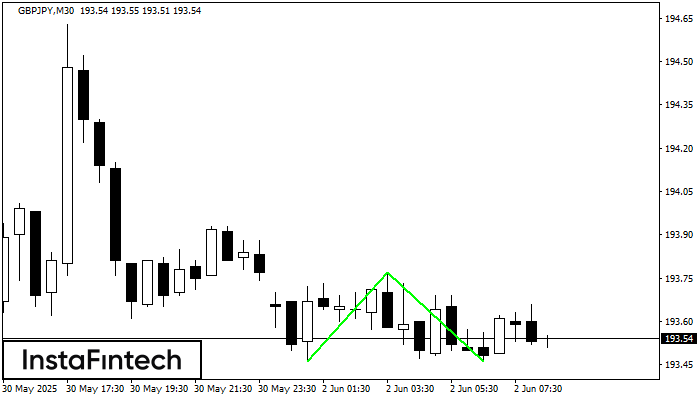
Doble Piso
was formed on 02.06 at 09:00:13 (UTC+0)
signal strength 3 of 5

El patrón Doble Piso ha sido formado en GBPJPY M30. Características: el nivel de soporte 193.37; el nivel de resistencia 194.63; el ancho del patrón 126 puntos. Si el nivel
Open chart in a new window
Doble Piso
was formed on 02.06 at 07:30:09 (UTC+0)
signal strength 3 of 5
El patrón Doble Piso ha sido formado en GBPJPY M30. Características: el nivel de soporte 193.46; el nivel de resistencia 193.77; el ancho del patrón 31 puntos. Si el nivel
Open chart in a new window
Doble Techo
was formed on 02.06 at 02:00:22 (UTC+0)
signal strength 3 of 5
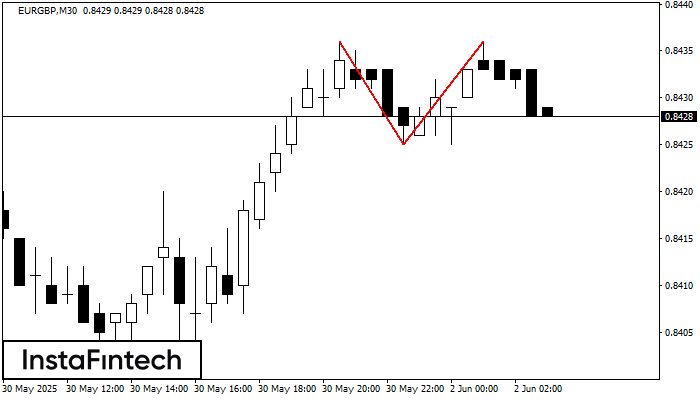
El patrón Doble Techo ha sido formado en EURGBP M30. Esto señala que la tendencia ha sido cambiada de alcista a bajista. Probablemente, si la base del patrón 0.8425
Open chart in a new window


