Actual patterns

Patterns are graphical models which are formed in the chart by the price. According to one of the technical analysis postulates, history (price movement) repeats itself. It means that the price movements are often similar in the same situations which makes it possible to predict the further development of the situation with a high probability.
Relevant patterns by InstaTrade is an easy-to-use service which allows you to be aware of latest changes in the market and react to clues from the market in time. In our service you will always find the latest and most relevant patterns on any pair and any timeframe.
Bullish Symmetrical Triangle
was formed on 16.04 at 06:40:55 (UTC+0)
signal strength 2 of 5

According to the chart of M15, AUDCAD formed the Bullish Symmetrical Triangle pattern. The lower border of the pattern touches the coordinates 0.8813/0.8844 whereas the upper border goes across 0.8874/0.8844. If the Bullish Symmetrical Triangle pattern is in progress, this evidently signals a further upward trend. In other words, in case the scenario comes true, the price of AUDCAD will breach the upper border to head for 0.8867.
The M5 and M15 time frames may have more false entry points.
See Also
- All
- All
- Bearish Rectangle
- Bearish Symmetrical Triangle
- Bearish Symmetrical Triangle
- Bullish Rectangle
- Double Top
- Double Top
- Triple Bottom
- Triple Bottom
- Triple Top
- Triple Top
- All
- All
- Buy
- Sale
- All
- 1
- 2
- 3
- 4
- 5
Бычий флаг
сформирован 14.08 в 03:00:07 (UTC+0)
сила сигнала 3 из 5
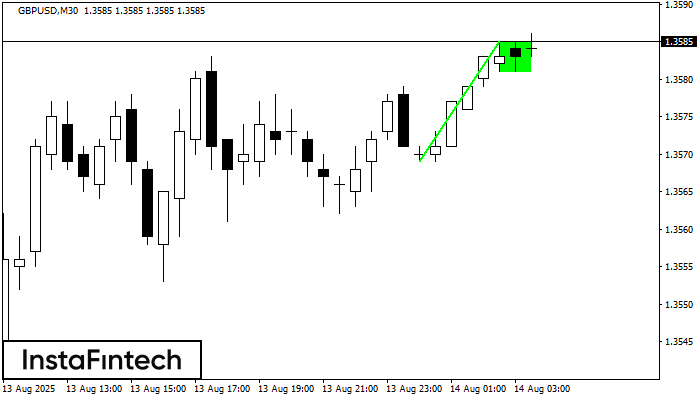
На графике GBPUSD M30 сформировалась фигура продолжения тренда «Бычий флаг». Прогноз: Фиксация цены выше максимума фигуры 1.3585 предоставит трейдеру возможность открыть длинную позицию на покупку до уровня 1.3615
Открыть график инструмента в новом окне
Двойная вершина
сформирован 14.08 в 01:30:36 (UTC+0)
сила сигнала 2 из 5
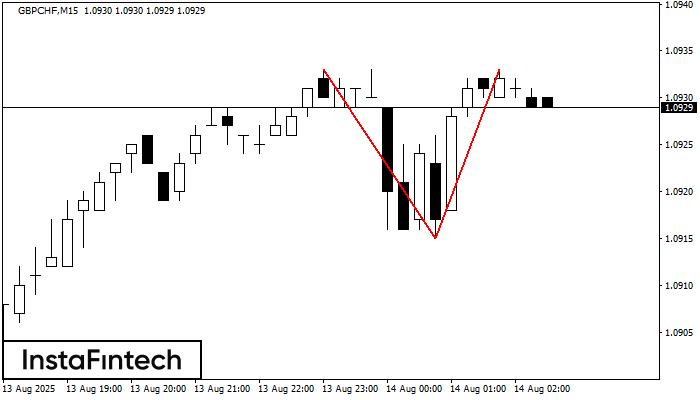
На торговом графике GBPCHF M15 сформировалась разворотная фигура «Двойная вершина». Характеристика: Верхняя граница 1.0933; Нижняя граница 1.0915; Ширина фигуры 18 пунктов. Сигнал: Пробой нижней границы 1.0915 приведет к дальнейшему нисходящему
Таймфреймы М5 и М15 могут иметь больше ложных точек входа.
Открыть график инструмента в новом окне
Двойное дно
сформирован 14.08 в 01:26:33 (UTC+0)
сила сигнала 1 из 5
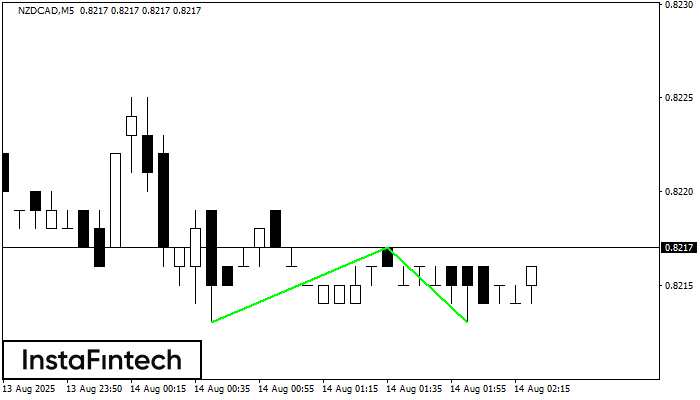
Сформирована фигура «Двойное дно» на графике NZDCAD M5. Верхняя граница 0.8217; Нижняя граница 0.8213; Ширина фигуры 4 пунктов. В случае пробоя верхней границы 0.8217 можно будет прогнозировать изменение тенденции
Таймфреймы М5 и М15 могут иметь больше ложных точек входа.
Открыть график инструмента в новом окне