

Actual patterns

Patterns are graphical models which are formed in the chart by the price. According to one of the technical analysis postulates, history (price movement) repeats itself. It means that the price movements are often similar in the same situations which makes it possible to predict the further development of the situation with a high probability.
Relevant patterns by InstaTrade is an easy-to-use service which allows you to be aware of latest changes in the market and react to clues from the market in time. In our service you will always find the latest and most relevant patterns on any pair and any timeframe.
Bullish Rectangle
was formed on 15.04 at 08:45:45 (UTC+0)
signal strength 1 of 5
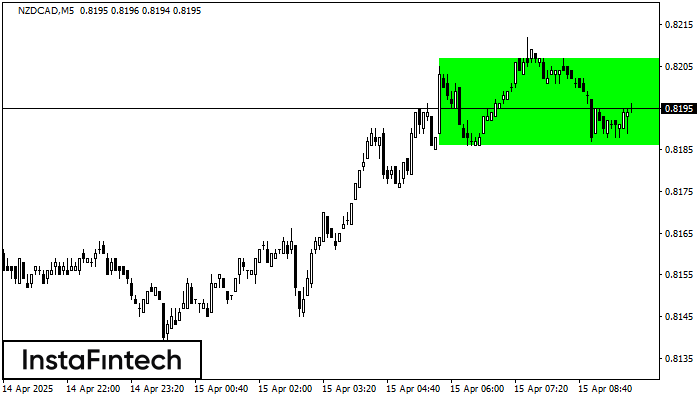
According to the chart of M5, NZDCAD formed the Bullish Rectangle. The pattern indicates a trend continuation. The upper border is 0.8207, the lower border is 0.8186. The signal means that a long position should be opened above the upper border 0.8207 of the Bullish Rectangle.
The M5 and M15 time frames may have more false entry points.
- All
- All
- Bearish Rectangle
- Bearish Symmetrical Triangle
- Bearish Symmetrical Triangle
- Bullish Rectangle
- Double Top
- Double Top
- Triple Bottom
- Triple Bottom
- Triple Top
- Triple Top
- All
- All
- Buy
- Sale
- All
- 1
- 2
- 3
- 4
- 5
Triple Top
was formed on 01.06 at 02:15:04 (UTC+0)
signal strength 2 of 5

Pada carta instrumen dagangan #Bitcoin M15, corak Triple Top yang menandakan perubahan aliran telah terbentuk. Adalah mungkin bahawa selepas pembentukan bahagian atas ketiga, harga akan cuba menembusi tahap rintangan 104215.56
Carta masa M5 dan M15 mungkin mempunyai lebih banyak titik kemasukan palsu.
Open chart in a new window
Double Top
was formed on 01.06 at 01:00:35 (UTC+0)
signal strength 3 of 5

Corak pembalikan Double Top telah dibentuk pada #Bitcoin M30. Ciri-ciri: sempadan atas %P0.000000; sempadan bawah 104800.13; sempadan bawah 104215.56; lebar corak adalah 64024 mata. Dagangan menjual adalah lebih baik untuk
Open chart in a new window
Segi Empat Menaik
was formed on 31.05 at 19:15:46 (UTC+0)
signal strength 1 of 5

Berdasarkan carta M5, #Bitcoin telah membentuk Segi Empat Menaik yang merupakan corak kesinambungan aliran. Corak adalah terkandung dalam sempadan berikut: sempadan bawah 104335.43 – 104335.43 dan sempadan atas 104800.13 –
Carta masa M5 dan M15 mungkin mempunyai lebih banyak titik kemasukan palsu.
Open chart in a new window


