

Actual patterns

Patterns are graphical models which are formed in the chart by the price. According to one of the technical analysis postulates, history (price movement) repeats itself. It means that the price movements are often similar in the same situations which makes it possible to predict the further development of the situation with a high probability.
Relevant patterns by InstaTrade is an easy-to-use service which allows you to be aware of latest changes in the market and react to clues from the market in time. In our service you will always find the latest and most relevant patterns on any pair and any timeframe.
Bullish Symmetrical Triangle
was formed on 15.04 at 00:15:23 (UTC+0)
signal strength 2 of 5
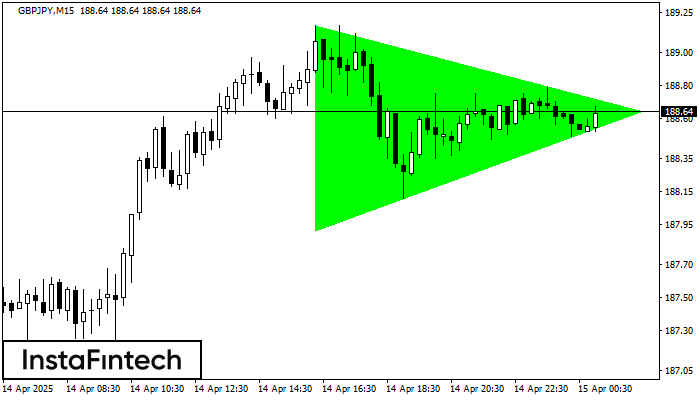
According to the chart of M15, GBPJPY formed the Bullish Symmetrical Triangle pattern. The lower border of the pattern touches the coordinates 187.91/188.64 whereas the upper border goes across 189.17/188.64. If the Bullish Symmetrical Triangle pattern is in progress, this evidently signals a further upward trend. In other words, in case the scenario comes true, the price of GBPJPY will breach the upper border to head for 188.87.
The M5 and M15 time frames may have more false entry points.
See Also
- All
- All
- Bearish Rectangle
- Bearish Symmetrical Triangle
- Bearish Symmetrical Triangle
- Bullish Rectangle
- Double Top
- Double Top
- Triple Bottom
- Triple Bottom
- Triple Top
- Triple Top
- All
- All
- Buy
- Sale
- All
- 1
- 2
- 3
- 4
- 5
Bawah Ganda
was formed on 02.06 at 06:15:53 (UTC+0)
signal strength 2 of 5
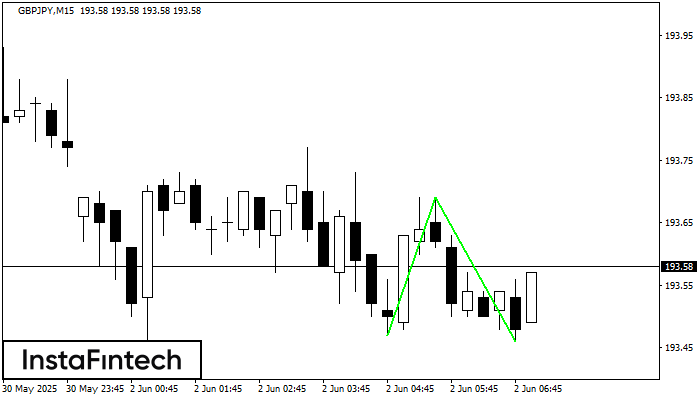
Pola Bawah Ganda telah terbentuk pada GBPJPY M15. Karakteristik: level support 193.47; level resistance 193.69; lebar pola 22 poin. Jika level resistance ditembus, perubahan dalam tren dapat diprediksi dengan target
Rangka waktu M5 dan M15 mungkin memiliki lebih dari titik entri yang keliru.
Open chart in a new window
Persegi Bullish
was formed on 02.06 at 06:00:14 (UTC+0)
signal strength 2 of 5
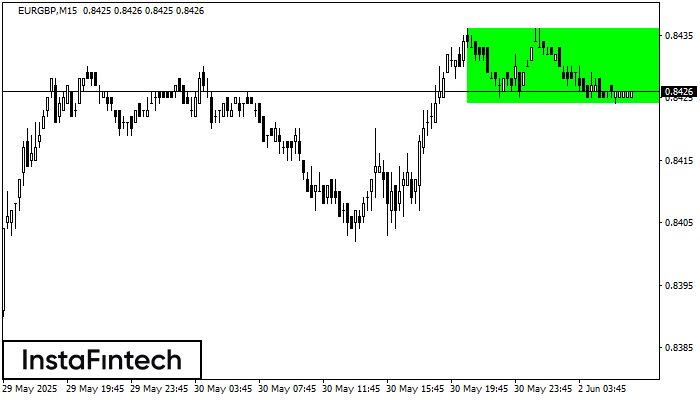
Menurut grafik dari M15, EURGBP terbentuk Persegi Bullish. Jenis pola ini menunjukkan kelanjutan tren. Terdiri dari dua tingkat: resistance 0.8436 dan support 0.8424. Jika level resistance 0.8436 - 0.8436 ditembus
Rangka waktu M5 dan M15 mungkin memiliki lebih dari titik entri yang keliru.
Open chart in a new window
Bawah Triple
was formed on 02.06 at 06:00:03 (UTC+0)
signal strength 4 of 5
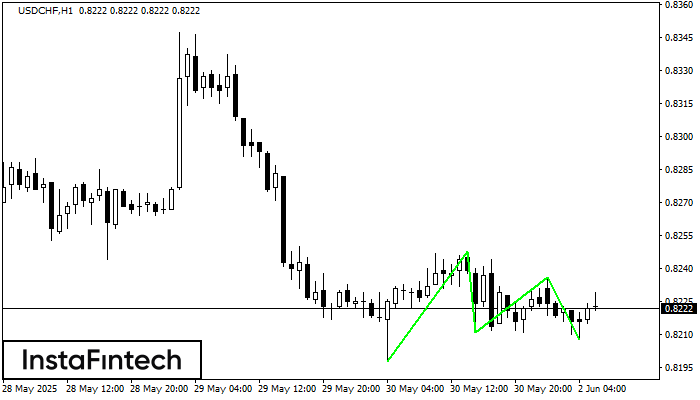
Pola Bawah Triple telah terbentuk pada grafik instrumen trading USDCHF H1. Pola tersebut menandakan perubahan dalam trend dari menurun menjadi naik jika terjadi pemecahan (breakdown) 0.8248/0.8236
Open chart in a new window


