

Actual patterns

Patterns are graphical models which are formed in the chart by the price. According to one of the technical analysis postulates, history (price movement) repeats itself. It means that the price movements are often similar in the same situations which makes it possible to predict the further development of the situation with a high probability.
Relevant patterns by InstaTrade is an easy-to-use service which allows you to be aware of latest changes in the market and react to clues from the market in time. In our service you will always find the latest and most relevant patterns on any pair and any timeframe.
Double Top
was formed on 14.04 at 11:20:29 (UTC+0)
signal strength 1 of 5
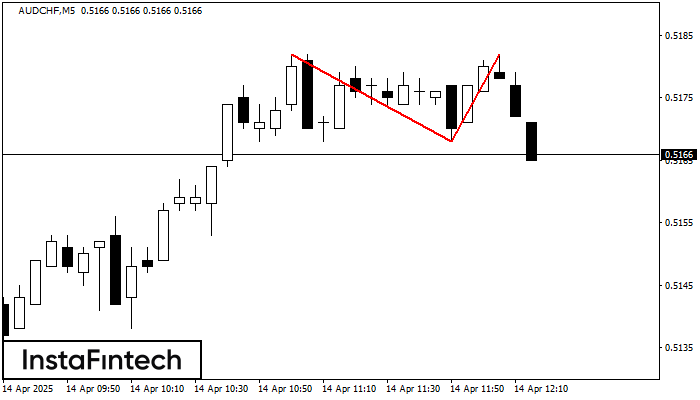
The Double Top pattern has been formed on AUDCHF M5. It signals that the trend has been changed from upwards to downwards. Probably, if the base of the pattern 0.5168 is broken, the downward movement will continue.
The M5 and M15 time frames may have more false entry points.
- All
- All
- Bearish Rectangle
- Bearish Symmetrical Triangle
- Bearish Symmetrical Triangle
- Bullish Rectangle
- Double Top
- Double Top
- Triple Bottom
- Triple Bottom
- Triple Top
- Triple Top
- All
- All
- Buy
- Sale
- All
- 1
- 2
- 3
- 4
- 5
Teratas Triple
was formed on 01.06 at 02:15:04 (UTC+0)
signal strength 2 of 5

Pada grafik instrumen trading #Bitcoin M15, pola Teratas Triple yang menandakan perubahan trend telah terbentuk. Ada kemungkinan bahwa setelah pembentukan puncak (peak) ketiga, harga akan mencoba untuk menembus level resistance
Rangka waktu M5 dan M15 mungkin memiliki lebih dari titik entri yang keliru.
Open chart in a new window
Teratas Ganda
was formed on 01.06 at 01:00:35 (UTC+0)
signal strength 3 of 5

Pola reversal Teratas Ganda telah terbentuk pada #Bitcoin M30. Karakteristik: batas atas 104800.13; batas bawah 104215.56; lebar pola 64024 poin. Transaksi jual lebih baik dibuka di bawah batas bawah 104215.56
Open chart in a new window
Persegi Bullish
was formed on 31.05 at 19:15:46 (UTC+0)
signal strength 1 of 5

Menurut grafik dari M5, #Bitcoin terbentuk Persegi Bullish yang merupakan pola dari kelanjutan tren. Pola terkandung dalam batas berikut: batas yang lebih rendah 104335.43 – 104335.43 dan batas atas 104800.13
Rangka waktu M5 dan M15 mungkin memiliki lebih dari titik entri yang keliru.
Open chart in a new window


