

Actual patterns

Patterns are graphical models which are formed in the chart by the price. According to one of the technical analysis postulates, history (price movement) repeats itself. It means that the price movements are often similar in the same situations which makes it possible to predict the further development of the situation with a high probability.
Relevant patterns by InstaTrade is an easy-to-use service which allows you to be aware of latest changes in the market and react to clues from the market in time. In our service you will always find the latest and most relevant patterns on any pair and any timeframe.
Bullish Rectangle
was formed on 14.04 at 00:42:49 (UTC+0)
signal strength 1 of 5
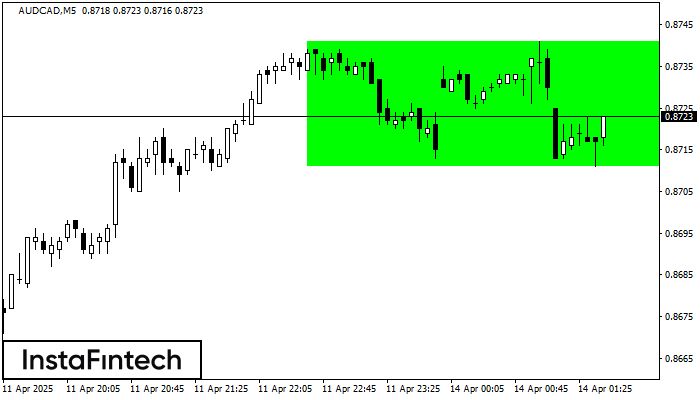
According to the chart of M5, AUDCAD formed the Bullish Rectangle which is a pattern of a trend continuation. The pattern is contained within the following borders: the lower border 0.8711 – 0.8711 and upper border 0.8741 – 0.8741. In case the upper border is broken, the instrument is likely to follow the upward trend.
The M5 and M15 time frames may have more false entry points.
See Also
- All
- All
- Bearish Rectangle
- Bearish Symmetrical Triangle
- Bearish Symmetrical Triangle
- Bullish Rectangle
- Double Top
- Double Top
- Triple Bottom
- Triple Bottom
- Triple Top
- Triple Top
- All
- All
- Buy
- Sale
- All
- 1
- 2
- 3
- 4
- 5
รูปแบบกราฟจุดสามยอด (Triple Top)
was formed on 03.06 at 00:30:20 (UTC+0)
signal strength 3 of 5
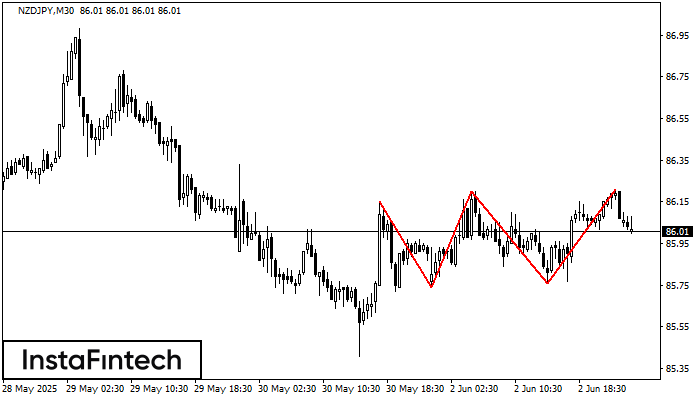
รูปแบบ รูปแบบกราฟจุดสามยอด (Triple Top) ได้สร้างขึ้นมาในชาร์ตของ NZDJPY M30 คุณลักษณะของกราฟรูปแบบนี้: ขอบเขตมีมุมหงายขึ้น; เส้นด้านล่างของกราฟรูปแบบนี้มีพิกัดอยู่ที่ 85.74/85.76 พร้อมกับลิมิตขาขึ้น 86.15/86.21; ระยะของความกว้างคือ
Open chart in a new window
รูปแบบกราฟจุดสามยอดขาลง (Triple Bottom)
was formed on 03.06 at 00:05:20 (UTC+0)
signal strength 1 of 5

รูปแบบ รูปแบบกราฟจุดสามยอดขาลง (Triple Bottom) ได้สร้างขึ้นมาในชาร์ตของ USDJPY M5 ลักษณะของกราฟรูปแบบนี้: เส้นด้านล่างของกราฟรูปแบบนี้มีพิกัดอยู่ที่ 142.75 พร้อมกับลิมิตด้านบน 142.75/142.69,ระยะของความกว้างคือ 7 จุด การก่อตัวของกราฟรูปแบบ
ขอบเตระยะเวลาใน M5 และ M15 อาจจะมีตำแหน่งการเข้าใช้งานที่ผิดพลาดมากยิ่งขึ้น
Open chart in a new window
รูปแบบกราฟจุดสามยอดขาลง (Triple Bottom)
was formed on 03.06 at 00:00:22 (UTC+0)
signal strength 3 of 5
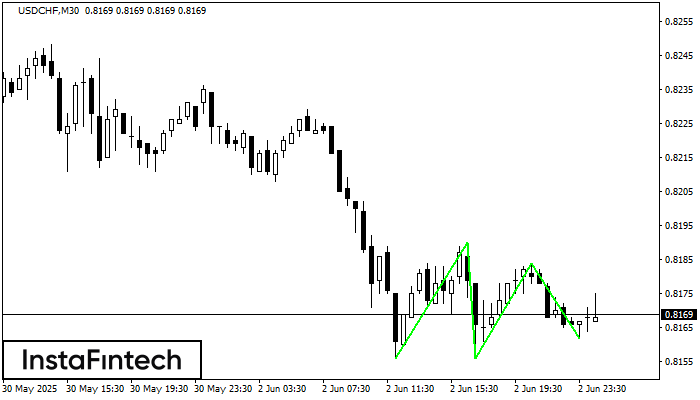
รูปแบบ รูปแบบกราฟจุดสามยอดขาลง (Triple Bottom) ได้สร้างขึ้นมาในชาร์ตของ USDCHF M30 ที่เป็นตราสารการซื้อขาย รูปแบบนี้แสดงถึงการเปลี่่ยนแปลงในแนวโน้มจากแนวโน้มขาลง ไปเป็นแนวโน้มขาขึ้น ในกรณีที่มีการเคลื่อนตัวทะลุผ่านที่ 0.8190/0.8184
Open chart in a new window


