

Actual patterns

Patterns are graphical models which are formed in the chart by the price. According to one of the technical analysis postulates, history (price movement) repeats itself. It means that the price movements are often similar in the same situations which makes it possible to predict the further development of the situation with a high probability.
Relevant patterns by InstaTrade is an easy-to-use service which allows you to be aware of latest changes in the market and react to clues from the market in time. In our service you will always find the latest and most relevant patterns on any pair and any timeframe.
Inverse Head and Shoulder
was formed on 11.04 at 15:59:57 (UTC+0)
signal strength 3 of 5

According to the chart of M30, AUDCHF produced the pattern termed the Inverse Head and Shoulder. The Head is fixed at 0.5043 while the median line of the Neck is set at 0.5120/0.5113. The formation of the Inverse Head and Shoulder Pattern clearly indicates a reversal of the downward trend. In means that in case the scenario comes true, the price of AUDCHF will go towards 0.5143.
- All
- All
- Bearish Rectangle
- Bearish Symmetrical Triangle
- Bearish Symmetrical Triangle
- Bullish Rectangle
- Double Top
- Double Top
- Triple Bottom
- Triple Bottom
- Triple Top
- Triple Top
- All
- All
- Buy
- Sale
- All
- 1
- 2
- 3
- 4
- 5
Тройное дно
сформирован 30.05 в 18:05:59 (UTC+0)
сила сигнала 1 из 5
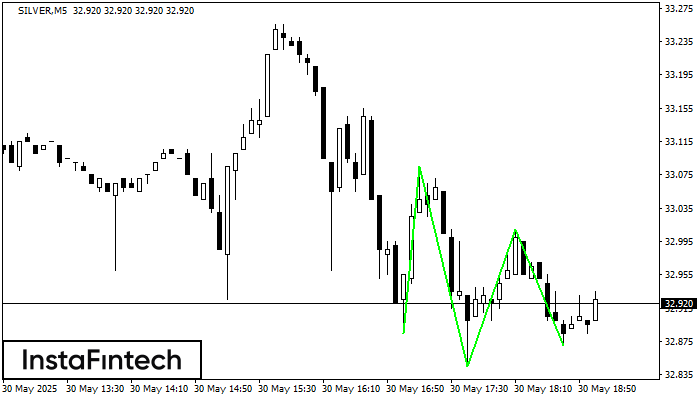
По SILVER на M5 сформировалась фигура «Тройное дно». Характеристика: Нижняя граница фигуры имеет координаты 32.87, при этом верхняя граница 33.09/33.01. Проекция ширины 240 пунктов. Формирование фигуры «Тройное дно» наиболее вероятным
Таймфреймы М5 и М15 могут иметь больше ложных точек входа.
Открыть график инструмента в новом окне
Прямоугольник
сформирован 30.05 в 18:05:41 (UTC+0)
сила сигнала 1 из 5
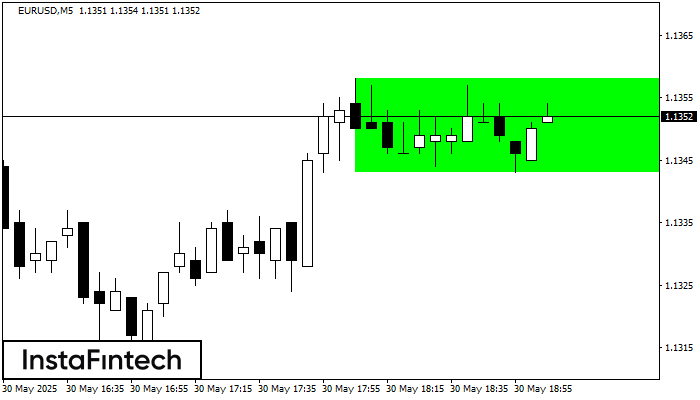
Сформирована фигура «Прямоугольник» на графике EURUSD M5. Тип фигуры: Продолжение тренда; Границы: Верхняя 1.1358, Нижняя 1.1343; Сигнал: позицию на покупку следует открывать выше верхней границы прямоугольника 1.1358
Таймфреймы М5 и М15 могут иметь больше ложных точек входа.
Открыть график инструмента в новом окне
Двойная вершина
сформирован 30.05 в 18:00:11 (UTC+0)
сила сигнала 1 из 5
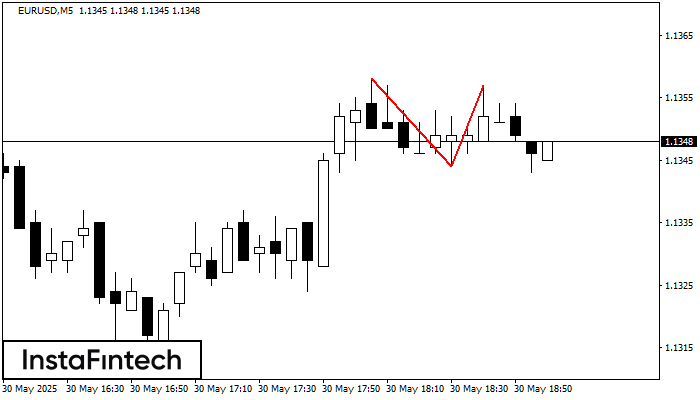
На торговом графике EURUSD M5 сформировалась разворотная фигура «Двойная вершина». Характеристика: Верхняя граница 1.1357; Нижняя граница 1.1344; Ширина фигуры 13 пунктов. Сигнал: Пробой нижней границы 1.1344 приведет к дальнейшему нисходящему
Таймфреймы М5 и М15 могут иметь больше ложных точек входа.
Открыть график инструмента в новом окне


