

Actual patterns

Patterns are graphical models which are formed in the chart by the price. According to one of the technical analysis postulates, history (price movement) repeats itself. It means that the price movements are often similar in the same situations which makes it possible to predict the further development of the situation with a high probability.
Relevant patterns by InstaTrade is an easy-to-use service which allows you to be aware of latest changes in the market and react to clues from the market in time. In our service you will always find the latest and most relevant patterns on any pair and any timeframe.
Bullish Rectangle
was formed on 10.04 at 04:30:30 (UTC+0)
signal strength 3 of 5
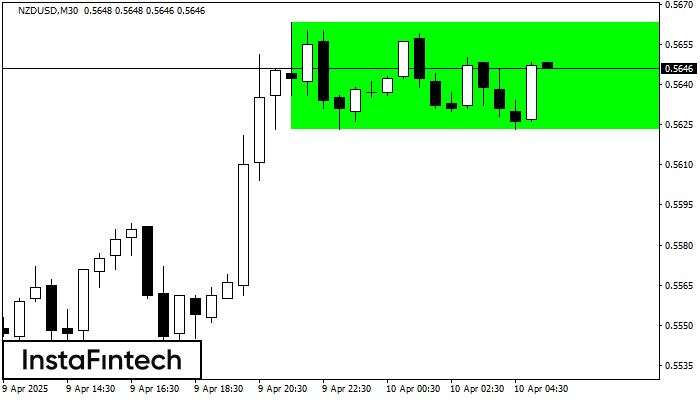
According to the chart of M30, NZDUSD formed the Bullish Rectangle. The pattern indicates a trend continuation. The upper border is 0.5663, the lower border is 0.5623. The signal means that a long position should be opened above the upper border 0.5663 of the Bullish Rectangle.
- All
- All
- Bearish Rectangle
- Bearish Symmetrical Triangle
- Bearish Symmetrical Triangle
- Bullish Rectangle
- Double Top
- Double Top
- Triple Bottom
- Triple Bottom
- Triple Top
- Triple Top
- All
- All
- Buy
- Sale
- All
- 1
- 2
- 3
- 4
- 5
รูปแบบสามเหลี่ยมสมมาตรขาขึ้น (Bullish Symmetrical Triangle)
was formed on 24.05 at 18:46:25 (UTC+0)
signal strength 2 of 5

อ้างอิงจากชาร์ตของ M15, #Bitcoin ที่ได้สร้างรูปแบบ รูปแบบสามเหลี่ยมสมมาตรขาขึ้น (Bullish Symmetrical Triangle) ออกมา ซึ่งแสดงให้เห็นว่า แนวโน้มยังคงเดินหน้าต่อไป คำอธิบาย ขอบเขตด้านบนของรูปแบบนี้สัมผัสพิกัด 109440.14/108872.57 แม้ว่าขอบเขตด้านล่างก้าวผ่าน
ขอบเตระยะเวลาใน M5 และ M15 อาจจะมีตำแหน่งการเข้าใช้งานที่ผิดพลาดมากยิ่งขึ้น
Open chart in a new window
รูปแบบกราฟสี่เหลี่ยมผืนผ้าขาลง (Bearish Rectangle)
was formed on 23.05 at 23:00:20 (UTC+0)
signal strength 1 of 5

อ้างอิงจากชาร์ตของ M5, EURNZD ที่ได้สร้างรูปแบบ รูปแบบกราฟสี่เหลี่ยมผืนผ้าขาลง (Bearish Rectangle) ออกมา รูปแบบนี้แสดงถึง ความต่อเนื่องในแนวโน้ม ขอบเขตด้านบนคือ 1.8982 ส่วนขอบเขตด้านล่างคือ 1.8964 สัญญาณนี้แสดงถึง
ขอบเตระยะเวลาใน M5 และ M15 อาจจะมีตำแหน่งการเข้าใช้งานที่ผิดพลาดมากยิ่งขึ้น
Open chart in a new window
รูปแบบสามเหลี่ยมสมมาตรขาขึ้น (Bullish Symmetrical Triangle)
was formed on 23.05 at 22:14:53 (UTC+0)
signal strength 1 of 5

อ้างอิงจากชาร์ตของ M5, AUDCHF ที่ได้สร้างรูปแบบ รูปแบบสามเหลี่ยมสมมาตรขาขึ้น (Bullish Symmetrical Triangle) ออกมา คำอธิบาย: นี้คือรูปแบบของความต่อเนื่องในแนวโน้ม 0.5335 และ 0.5329 เป็นพิกัดของขอบเขตด้านบนและด้านล่าง
ขอบเตระยะเวลาใน M5 และ M15 อาจจะมีตำแหน่งการเข้าใช้งานที่ผิดพลาดมากยิ่งขึ้น
Open chart in a new window


