

Actual patterns

Patterns are graphical models which are formed in the chart by the price. According to one of the technical analysis postulates, history (price movement) repeats itself. It means that the price movements are often similar in the same situations which makes it possible to predict the further development of the situation with a high probability.
Relevant patterns by InstaTrade is an easy-to-use service which allows you to be aware of latest changes in the market and react to clues from the market in time. In our service you will always find the latest and most relevant patterns on any pair and any timeframe.
Bullish Symmetrical Triangle
was formed on 10.04 at 02:15:14 (UTC+0)
signal strength 2 of 5
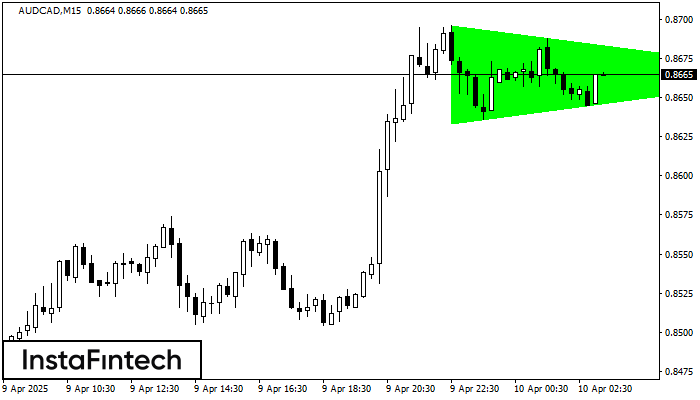
According to the chart of M15, AUDCAD formed the Bullish Symmetrical Triangle pattern, which signals the trend will continue. Description. The upper border of the pattern touches the coordinates 0.8696/0.8665 whereas the lower border goes across 0.8633/0.8665. The pattern width is measured on the chart at 63 pips. If the Bullish Symmetrical Triangle pattern is in progress during the upward trend, this indicates the current trend will go on. In case 0.8665 is broken, the price could continue its move toward 0.8687.
The M5 and M15 time frames may have more false entry points.
- All
- All
- Bearish Rectangle
- Bearish Symmetrical Triangle
- Bearish Symmetrical Triangle
- Bullish Rectangle
- Double Top
- Double Top
- Triple Bottom
- Triple Bottom
- Triple Top
- Triple Top
- All
- All
- Buy
- Sale
- All
- 1
- 2
- 3
- 4
- 5
Kepala dan bahu
was formed on 29.05 at 15:30:10 (UTC+0)
signal strength 2 of 5
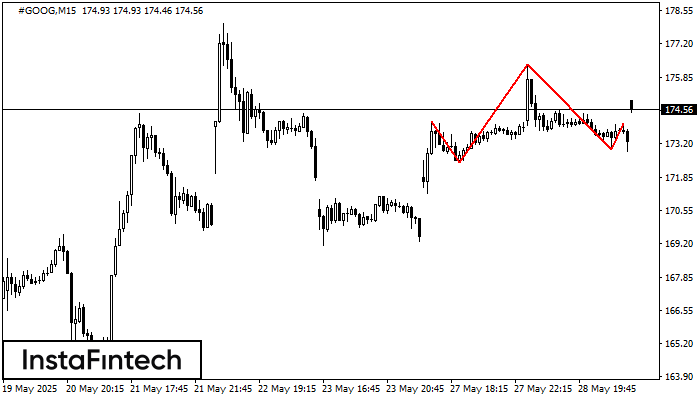
Menurut grafik M15, #GOOG membentuk pola Kepala dan bahu. Puncak The Head ditetapkan di 176.37 sementara garis median the Neck ditemukan di 172.46/172.97. Formasi pola Kepala dan bahu terbukti mensinyalkan
Rangka waktu M5 dan M15 mungkin memiliki lebih dari titik entri yang keliru.
Open chart in a new window
Bawah Ganda
was formed on 29.05 at 15:30:05 (UTC+0)
signal strength 5 of 5
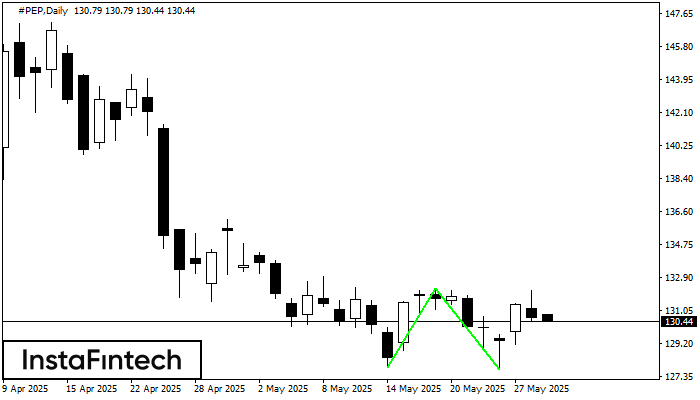
Pola Bawah Ganda telah terbentuk pada #PEP D1. Formasi ini mensinyalkan reversal tren dari arah penurunan ke arah kenaikan. Sinyal menunjukkan bahwa transaksi beli harus dibuka setelah batas atas pola
Open chart in a new window
Kepala dan Bahu Terbalik
was formed on 29.05 at 15:29:56 (UTC+0)
signal strength 4 of 5
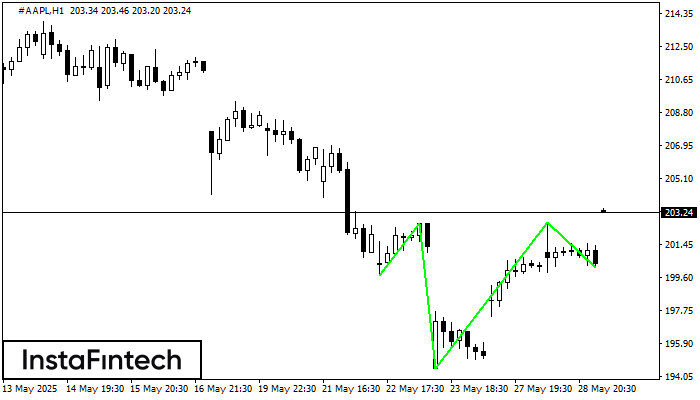
Menurut grafik H1, #AAPL menghasilkan pola yang disebut Kepala dan Bahu Terbalik. The Head ditetapkan di 194.47 sementara garis median The Neck ditetapkan di 202.62/202.68. Formasi Pola Kepala dan Bahu
Open chart in a new window


