

Actual patterns

Patterns are graphical models which are formed in the chart by the price. According to one of the technical analysis postulates, history (price movement) repeats itself. It means that the price movements are often similar in the same situations which makes it possible to predict the further development of the situation with a high probability.
Relevant patterns by InstaTrade is an easy-to-use service which allows you to be aware of latest changes in the market and react to clues from the market in time. In our service you will always find the latest and most relevant patterns on any pair and any timeframe.
Double Bottom
was formed on 07.04 at 18:30:12 (UTC+0)
signal strength 1 of 5

The Double Bottom pattern has been formed on #AAPL M5. This formation signals a reversal of the trend from downwards to upwards. The signal is that a buy trade should be opened after the upper boundary of the pattern 180.32 is broken. The further movements will rely on the width of the current pattern 444 points.
The M5 and M15 time frames may have more false entry points.
- All
- All
- Bearish Rectangle
- Bearish Symmetrical Triangle
- Bearish Symmetrical Triangle
- Bullish Rectangle
- Double Top
- Double Top
- Triple Bottom
- Triple Bottom
- Triple Top
- Triple Top
- All
- All
- Buy
- Sale
- All
- 1
- 2
- 3
- 4
- 5
Bawah Ganda
was formed on 30.05 at 09:30:30 (UTC+0)
signal strength 1 of 5
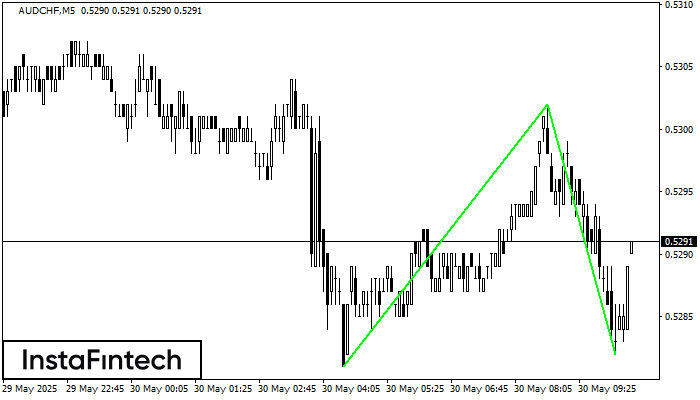
Pola Bawah Ganda telah terbentuk pada AUDCHF M5. Karakteristik: level support 0.5281; level resistance 0.5302; lebar pola 21 poin. Jika level resistance ditembus, perubahan dalam tren dapat diprediksi dengan target
Rangka waktu M5 dan M15 mungkin memiliki lebih dari titik entri yang keliru.
Open chart in a new window
Bawah Ganda
was formed on 30.05 at 09:30:14 (UTC+0)
signal strength 2 of 5
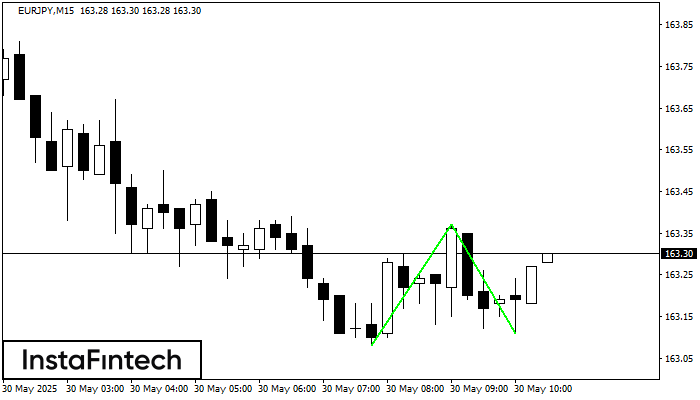
Pola Bawah Ganda telah terbentuk pada EURJPY M15. Karakteristik: level support 163.08; level resistance 163.37; lebar pola 29 poin. Jika level resistance ditembus, perubahan dalam tren dapat diprediksi dengan target
Rangka waktu M5 dan M15 mungkin memiliki lebih dari titik entri yang keliru.
Open chart in a new window
Bawah Triple
was formed on 30.05 at 09:00:12 (UTC+0)
signal strength 4 of 5
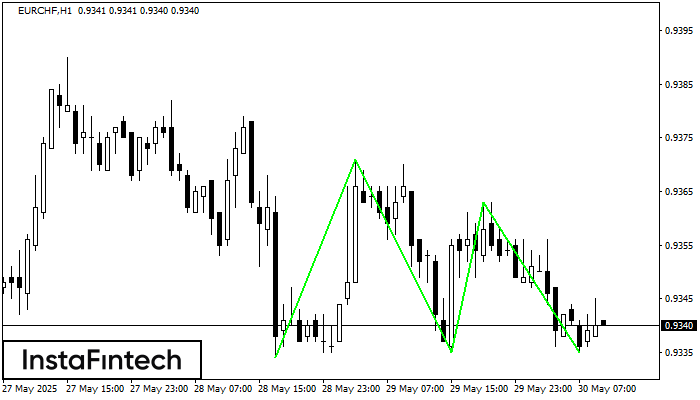
Pola Bawah Triple telah terbentuk pada grafik EURCHF H1. Fitur-fitur pola: garis bawah pola memiliki koordinat 0.9371 dengan batas atas 0.9371/0.9363, proyeksi lebar adalah 37 poin. Pembentukan pola Bawah Triple
Open chart in a new window


