

Actual patterns

Patterns are graphical models which are formed in the chart by the price. According to one of the technical analysis postulates, history (price movement) repeats itself. It means that the price movements are often similar in the same situations which makes it possible to predict the further development of the situation with a high probability.
Relevant patterns by InstaTrade is an easy-to-use service which allows you to be aware of latest changes in the market and react to clues from the market in time. In our service you will always find the latest and most relevant patterns on any pair and any timeframe.
Bearish Rectangle
was formed on 06.04 at 23:00:32 (UTC+0)
signal strength 3 of 5
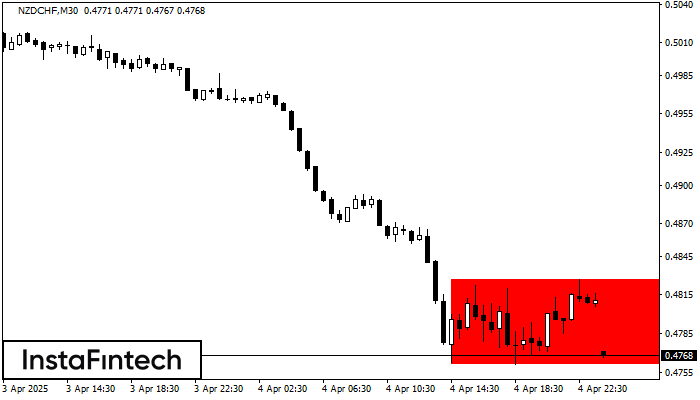
According to the chart of M30, NZDCHF formed the Bearish Rectangle. The pattern indicates a trend continuation. The upper border is 0.4827, the lower border is 0.4761. The signal means that a short position should be opened after fixing a price below the lower border 0.4761 of the Bearish Rectangle.
See Also
- All
- All
- Bearish Rectangle
- Bearish Symmetrical Triangle
- Bearish Symmetrical Triangle
- Bullish Rectangle
- Double Top
- Double Top
- Triple Bottom
- Triple Bottom
- Triple Top
- Triple Top
- All
- All
- Buy
- Sale
- All
- 1
- 2
- 3
- 4
- 5
Двойное дно
сформирован 01.06 в 23:00:15 (UTC+0)
сила сигнала 1 из 5
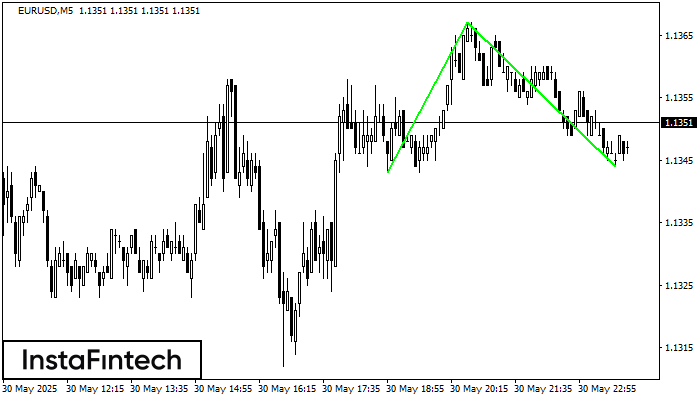
Сформирована фигура «Двойное дно» на графике EURUSD M5. Характеристика: Уровень поддержки 1.1343; Уровень сопротивления 1.1367; Ширина фигуры 24 пунктов. В случае пробоя уровня сопротивления можно будет прогнозировать изменение тенденции
Таймфреймы М5 и М15 могут иметь больше ложных точек входа.
Открыть график инструмента в новом окне
Двойная вершина
сформирован 01.06 в 23:00:15 (UTC+0)
сила сигнала 2 из 5
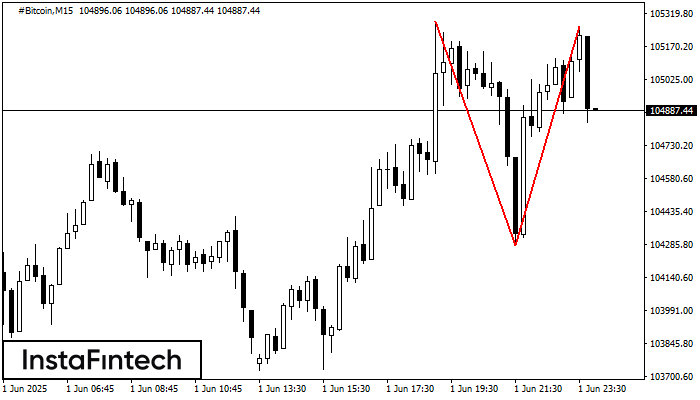
На торговом графике #Bitcoin M15 сформировалась разворотная фигура «Двойная вершина». Характеристика: Верхняя граница 105260.12; Нижняя граница 104281.85; Ширина фигуры 97827 пунктов. Сигнал: Пробой нижней границы 104281.85 приведет к дальнейшему нисходящему
Таймфреймы М5 и М15 могут иметь больше ложных точек входа.
Открыть график инструмента в новом окне
Тройная вершина
сформирован 01.06 в 02:15:04 (UTC+0)
сила сигнала 2 из 5

На графике #Bitcoin M15 образовалась фигура «Тройная вершина». Данная фигура относится к типу разворотных и имеет характеристику: Верхняя граница 104800.13/104799.73; Нижняя граница 104215.56/104423.26; Ширина фигуры 43254 пунктов. Прогноз: В случае
Таймфреймы М5 и М15 могут иметь больше ложных точек входа.
Открыть график инструмента в новом окне


