

Actual patterns

Patterns are graphical models which are formed in the chart by the price. According to one of the technical analysis postulates, history (price movement) repeats itself. It means that the price movements are often similar in the same situations which makes it possible to predict the further development of the situation with a high probability.
Relevant patterns by InstaTrade is an easy-to-use service which allows you to be aware of latest changes in the market and react to clues from the market in time. In our service you will always find the latest and most relevant patterns on any pair and any timeframe.
Double Bottom
was formed on 02.04 at 00:00:26 (UTC+0)
signal strength 3 of 5
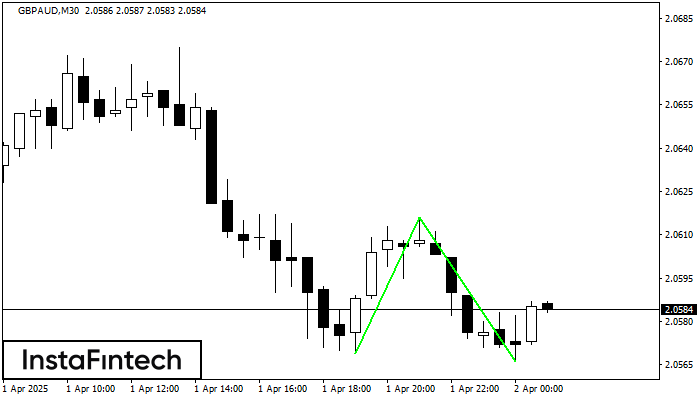
The Double Bottom pattern has been formed on GBPAUD M30; the upper boundary is 2.0616; the lower boundary is 2.0566. The width of the pattern is 47 points. In case of a break of the upper boundary 2.0616, a change in the trend can be predicted where the width of the pattern will coincide with the distance to a possible take profit level.
See Also
- All
- All
- Bearish Rectangle
- Bearish Symmetrical Triangle
- Bearish Symmetrical Triangle
- Bullish Rectangle
- Double Top
- Double Top
- Triple Bottom
- Triple Bottom
- Triple Top
- Triple Top
- All
- All
- Buy
- Sale
- All
- 1
- 2
- 3
- 4
- 5
Segitiga Simetris Bullish
was formed on 14.04 at 04:00:58 (UTC+0)
signal strength 4 of 5

Menurut Grafik dari H1, EURNZD dibentuk pola Segitiga Simetris Bullish. Deskripsi: Ini merupakan pola dari kelanjutan tren. 2.0005 dan 1.9118 adalah kordinat masing-masing dari batas atas dan lebih rendah. Lebar
Open chart in a new window
Persegi Bullish
was formed on 14.04 at 03:32:18 (UTC+0)
signal strength 1 of 5
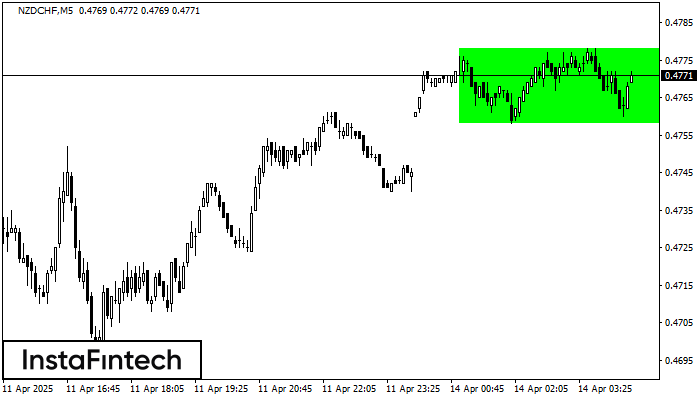
Menurut grafik dari M5, NZDCHF terbentuk Persegi Bullish. Pola menunjukkan kelanjutan tren. Batas atas adalah 0.4778, batas lebih rendah adalah 0.4758. Sinyal berarti posisi beli harus dibuka diatas batas atas
Rangka waktu M5 dan M15 mungkin memiliki lebih dari titik entri yang keliru.
Open chart in a new window
Bawah Triple
was formed on 14.04 at 03:00:24 (UTC+0)
signal strength 2 of 5

Pola Bawah Triple telah terbentuk pada EURNZD M15. Pola tersebut memiliki karakteristik sebagai berikut: level resistance 1.9498/1.9463; level support 1.9409/1.9402; dengan lebar 89 poin. Jika terjadi pemecahan (breakdown) pada level
Rangka waktu M5 dan M15 mungkin memiliki lebih dari titik entri yang keliru.
Open chart in a new window


