

Actual patterns

Patterns are graphical models which are formed in the chart by the price. According to one of the technical analysis postulates, history (price movement) repeats itself. It means that the price movements are often similar in the same situations which makes it possible to predict the further development of the situation with a high probability.
Relevant patterns by InstaTrade is an easy-to-use service which allows you to be aware of latest changes in the market and react to clues from the market in time. In our service you will always find the latest and most relevant patterns on any pair and any timeframe.
Bullish Symmetrical Triangle
was formed on 01.04 at 10:36:33 (UTC+0)
signal strength 3 of 5

According to the chart of M30, EURUSD formed the Bullish Symmetrical Triangle pattern. Description: This is the pattern of a trend continuation. 1.0849 and 1.0777 are the coordinates of the upper and lower borders respectively. The pattern width is measured on the chart at 72 pips. Outlook: If the upper border 1.0849 is broken, the price is likely to continue its move by 1.0844.
- All
- All
- Bearish Rectangle
- Bearish Symmetrical Triangle
- Bearish Symmetrical Triangle
- Bullish Rectangle
- Double Top
- Double Top
- Triple Bottom
- Triple Bottom
- Triple Top
- Triple Top
- All
- All
- Buy
- Sale
- All
- 1
- 2
- 3
- 4
- 5
Бычий симметричный треугольник
сформирован 05.06 в 13:00:44 (UTC+0)
сила сигнала 1 из 5
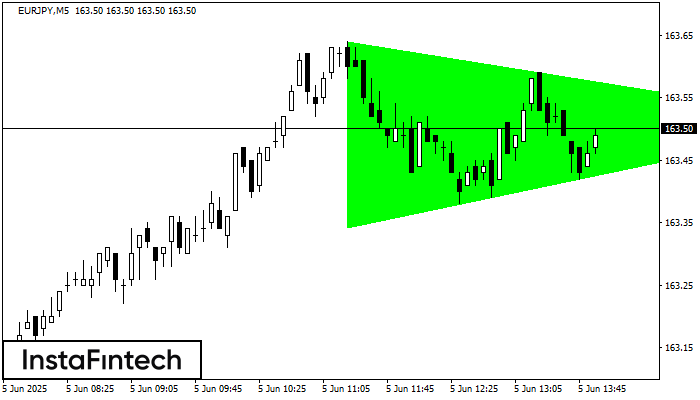
По EURJPY на M5 сформировалась фигура «Бычий симметричный треугольник», которая сигнализирует нам о продолжении тенденции. Характеристика: Верхняя граница фигуры имеет координаты 163.64/163.51; Нижняя граница 163.34/163.51; Проекция ширины фигуры 30 пунктов
Таймфреймы М5 и М15 могут иметь больше ложных точек входа.
Открыть график инструмента в новом окне
Бычий симметричный треугольник
сформирован 05.06 в 13:00:39 (UTC+0)
сила сигнала 1 из 5
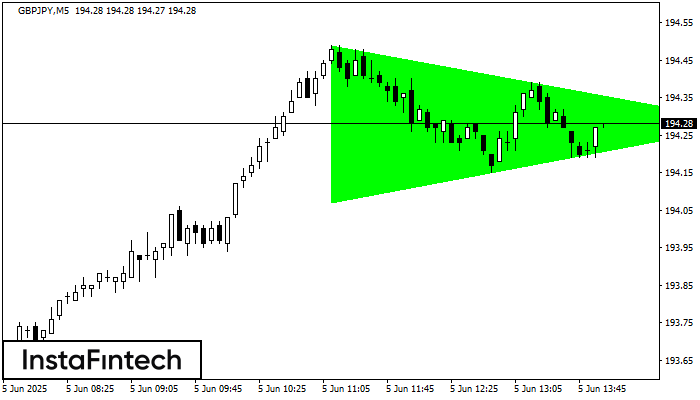
По GBPJPY на M5 сформировалась фигура «Бычий симметричный треугольник». Нижняя граница фигуры имеет координаты 194.07/194.28, при этом верхняя граница 194.49/194.28. Формирование фигуры «Бычий симметричный треугольник» наиболее вероятным образом свидетельствует
Таймфреймы М5 и М15 могут иметь больше ложных точек входа.
Открыть график инструмента в новом окне
Голова и плечи
сформирован 05.06 в 12:36:38 (UTC+0)
сила сигнала 1 из 5
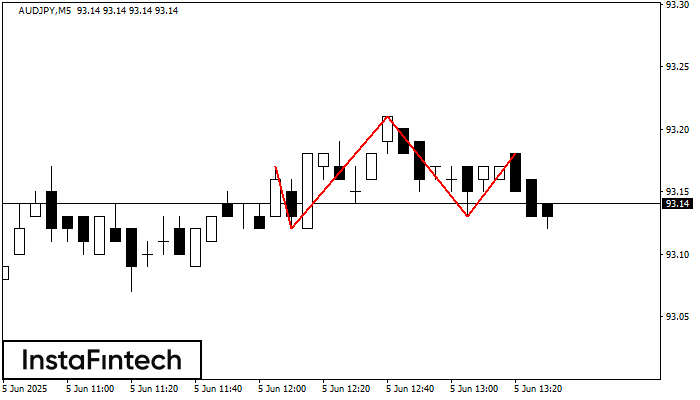
Графическая фигура «Голова и плечи» сформировалась по инструменту AUDJPY на M5. Вероятно предполагать, что после формирования правого плеча цена преодолеет уровень шеи 93.12/93.13, изменяя тем самым тенденцию и фактически направляя
Таймфреймы М5 и М15 могут иметь больше ложных точек входа.
Открыть график инструмента в новом окне


