Actual patterns

Patterns are graphical models which are formed in the chart by the price. According to one of the technical analysis postulates, history (price movement) repeats itself. It means that the price movements are often similar in the same situations which makes it possible to predict the further development of the situation with a high probability.
Relevant patterns by InstaTrade is an easy-to-use service which allows you to be aware of latest changes in the market and react to clues from the market in time. In our service you will always find the latest and most relevant patterns on any pair and any timeframe.
Triple Top
was formed on 28.03 at 01:30:25 (UTC+0)
signal strength 3 of 5
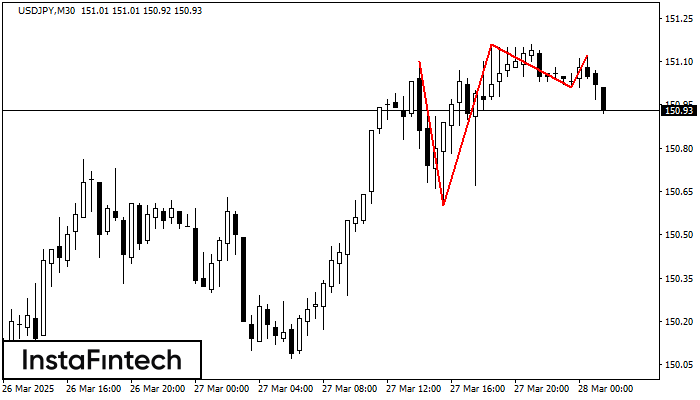
The Triple Top pattern has formed on the chart of the USDJPY M30 trading instrument. It is a reversal pattern featuring the following characteristics: resistance level -2, support level -41, and pattern’s width 50. Forecast If the price breaks through the support level 150.60, it is likely to move further down to 150.86.
See Also
- All
- All
- Bearish Rectangle
- Bearish Symmetrical Triangle
- Bearish Symmetrical Triangle
- Bullish Rectangle
- Double Top
- Double Top
- Triple Bottom
- Triple Bottom
- Triple Top
- Triple Top
- All
- All
- Buy
- Sale
- All
- 1
- 2
- 3
- 4
- 5
Teratas Ganda
was formed on 03.06 at 09:00:26 (UTC+0)
signal strength 4 of 5
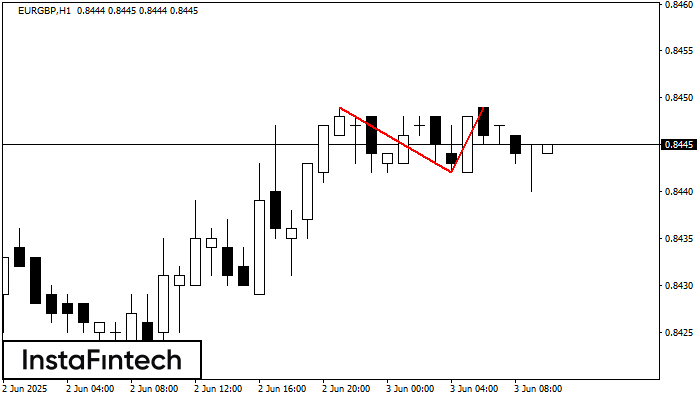
Pada grafik EURGBP H1 pola reversal Teratas Ganda telah terbentuk. Karakteristik: batas atas 0.8449; batas bawah 0.8442; lebar pola 7 poin. Sinyal: tembusan ke batas bawah akan menyebabkan kelanjutan tren
Open chart in a new window
Bawah Triple
was formed on 03.06 at 09:00:20 (UTC+0)
signal strength 1 of 5
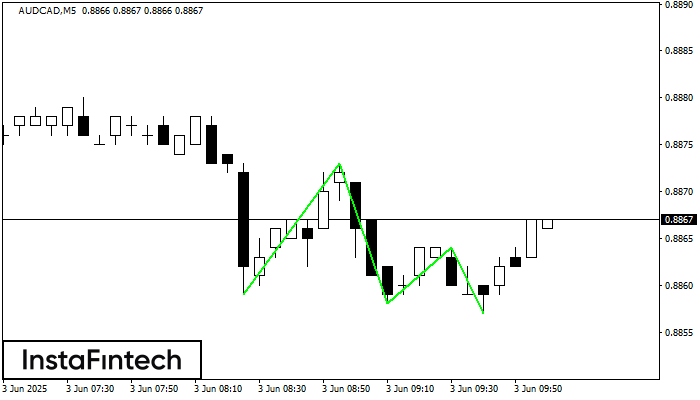
Pola Bawah Triple telah terbentuk pada grafik AUDCAD M5. Fitur-fitur pola: garis bawah pola memiliki koordinat 0.8873 dengan batas atas 0.8873/0.8864, proyeksi lebar adalah 14 poin. Pembentukan pola Bawah Triple
Rangka waktu M5 dan M15 mungkin memiliki lebih dari titik entri yang keliru.
Open chart in a new window
Bawah Ganda
was formed on 03.06 at 08:45:32 (UTC+0)
signal strength 1 of 5
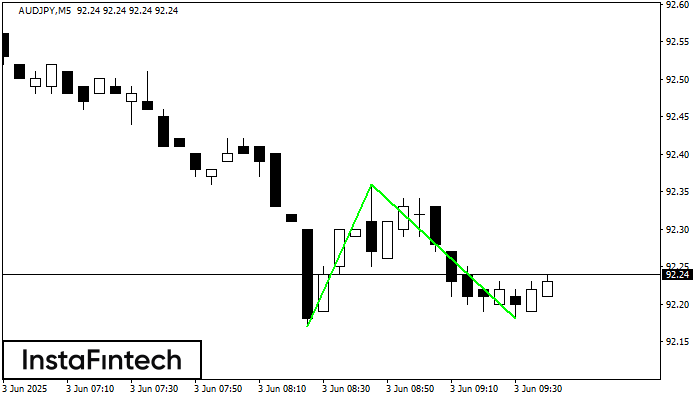
Pola Bawah Ganda telah terbentuk pada AUDJPY M5. Karakteristik: level support 92.17; level resistance 92.36; lebar pola 19 poin. Jika level resistance ditembus, perubahan dalam tren dapat diprediksi dengan target
Rangka waktu M5 dan M15 mungkin memiliki lebih dari titik entri yang keliru.
Open chart in a new window