
EURZAR (Euro vs South African Rand). Exchange rate and online charts.
Currency converter
03 Apr 2025 00:50
(0%)
Closing price, the previous day.
Opening price.
The highest price over the last trading day.
The lowest price over the last trading day
Price range high in the last week
Price range low in the last week
EUR/ZAR is quite popular on Forex. South Africa is an active European Union trading partner. Thus, EUR/ZAR attracts experienced traders who choose this instrument for high stability and predictability of the euro area and South Africa economies. Most of operations on this currency pair are carried out during the European session.
EUR/ZAR is greatly affected by the U.S. dollar as it represents a cross rate against the greenback. Hence, by combining the EUR/USD and USD/ZAR price charts, we can get an approximate EUR/ZAR chart.
The U.S. dollar has a significant influence on both currencies represented in EUR/ZAR. To correctly predict the further currency pair movement, it is necessary to take heed of such U.S. indicators as the discount rate, GDP, unemployment, new created workplaces, and many others. However, the currencies can respond differently towards the changes in the U.S. economy, therefore, EUR/ZAR currency pair may serve as a specific indicator for these currencies.
South Africa is the richest country in mineral deposits in Africa. It has one of the largest stock exchanges, which is among the ten largest world stock exchanges. South African's economy is based on the extraction and export of minerals.
South Africa has produced a large number of precious stones and metals, including gold and diamonds. In addition, the country is the largest car manufacturer in Africa. South Africa has all the necessary raw materials for production. For this reason, prices for precious stones and metals, and car manufacturing can greatly affect the South African Rand exchange rate.
If you trade cross rates, it is necessary to remember that brokers , usually, set a higher spread on crosses than on majors. So before you start working with the cross rates, familiarize yourself with the terms and conditions offered by the broker to trade with the specified instrument.
See Also
- Forecast for EUR/USD on April 2, 2025
Author: Samir Klishi
11:23 2025-04-02 UTC+2
958
Technical analysis of EUR/USD, USD/JPY, USDX and Bitcoin.Author: Sebastian Seliga
11:34 2025-04-02 UTC+2
898
XAU/USD. Analysis and ForecastAuthor: Irina Yanina
13:22 2025-04-02 UTC+2
853
- Technical analysis
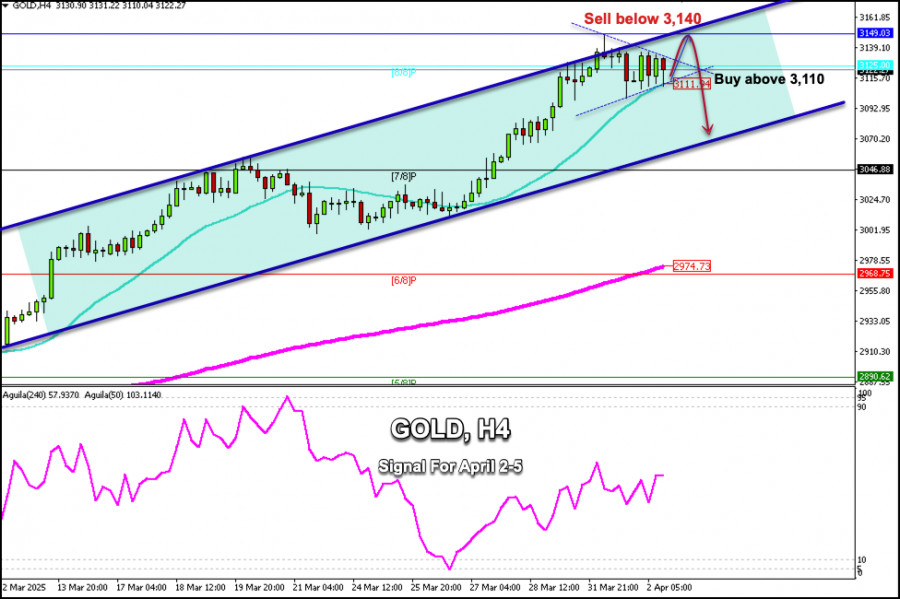
Trading Signals for GOLD (XAU/USD) for April 2-5, 2025: sell below $3,140 or buy above $3,110 (21 SMA - symmetrical triangle)
The symmetrical triangle pattern observed on the H4 chart shows that gold could experience a strong bullish impulse to reach 3,169, where resistance R_1 is located. Below this area, a technical correction could occur.Author: Dimitrios Zappas
15:15 2025-04-02 UTC+2
853
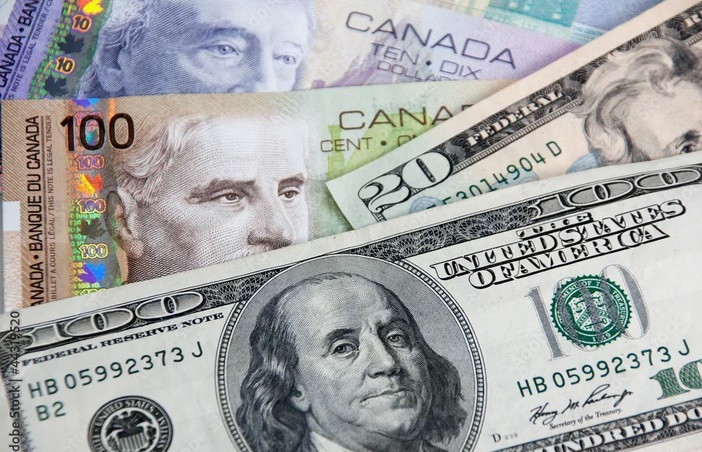
Today the USD/CAD pair is attempting to halt yesterday's decline, trying to hold above the 1.4300 level.Author: Irina Yanina
12:22 2025-04-02 UTC+2
823
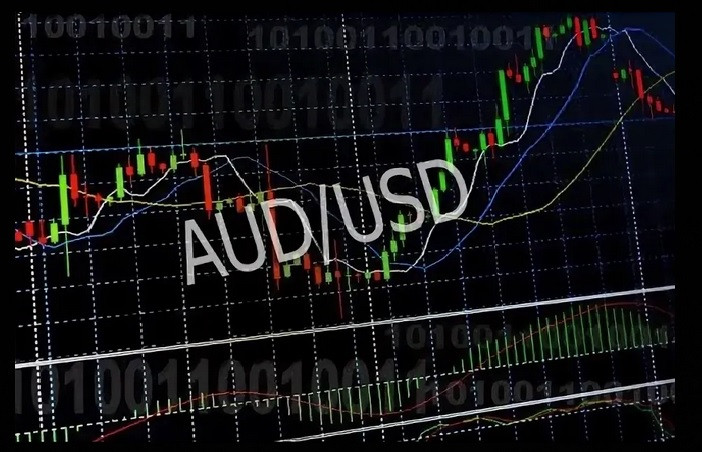
Today, the AUD/USD pair is showing positive momentum, rebounding from nearly a four-week low.Author: Irina Yanina
12:25 2025-04-02 UTC+2
823
- The BTC/USD pair managed to halt its decline, and the current wave structure suggests a potential rise in the world's leading cryptocurrency.
Author: Chin Zhao
12:17 2025-04-02 UTC+2
733
Market overview on April 2Author: Jozef Kovach
12:15 2025-04-02 UTC+2
718
Forecast for GBP/USD on April 2, 2025Author: Samir Klishi
11:17 2025-04-02 UTC+2
688
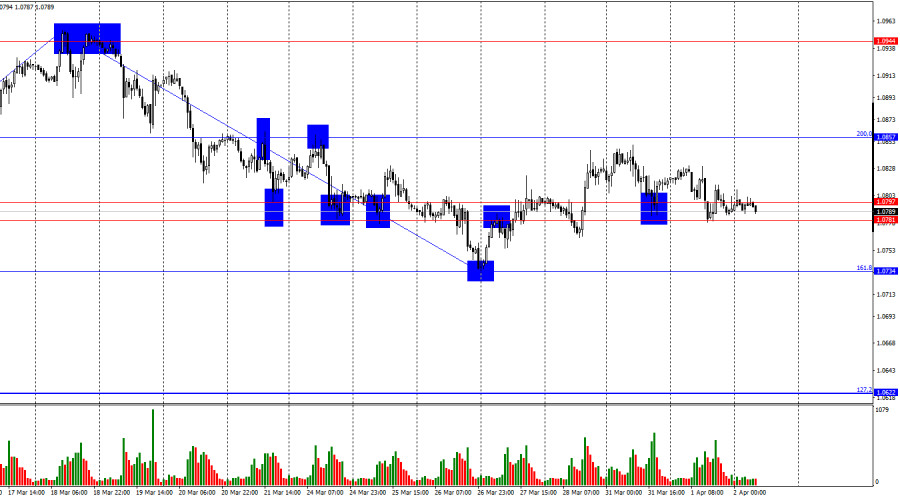


- Forecast for EUR/USD on April 2, 2025
Author: Samir Klishi
11:23 2025-04-02 UTC+2
958
- Technical analysis of EUR/USD, USD/JPY, USDX and Bitcoin.
Author: Sebastian Seliga
11:34 2025-04-02 UTC+2
898
- XAU/USD. Analysis and Forecast
Author: Irina Yanina
13:22 2025-04-02 UTC+2
853
- Technical analysis
Trading Signals for GOLD (XAU/USD) for April 2-5, 2025: sell below $3,140 or buy above $3,110 (21 SMA - symmetrical triangle)
The symmetrical triangle pattern observed on the H4 chart shows that gold could experience a strong bullish impulse to reach 3,169, where resistance R_1 is located. Below this area, a technical correction could occur.Author: Dimitrios Zappas
15:15 2025-04-02 UTC+2
853
- Today the USD/CAD pair is attempting to halt yesterday's decline, trying to hold above the 1.4300 level.
Author: Irina Yanina
12:22 2025-04-02 UTC+2
823
- Today, the AUD/USD pair is showing positive momentum, rebounding from nearly a four-week low.
Author: Irina Yanina
12:25 2025-04-02 UTC+2
823
- The BTC/USD pair managed to halt its decline, and the current wave structure suggests a potential rise in the world's leading cryptocurrency.
Author: Chin Zhao
12:17 2025-04-02 UTC+2
733
- Forecast for GBP/USD on April 2, 2025
Author: Samir Klishi
11:17 2025-04-02 UTC+2
688


