यह भी देखें


रेक्टैंगल - व्यापार में तकनीकी विश्लेषण के सबसे प्रसिद्ध और सरल तरीकों में से एक। हालांकि चार्ट पर निर्धारित करना आसान है, यह एक महत्वपूर्ण और बहुत मजबूत आंकड़ा है, जो प्रवृत्ति की निरंतरता का संकेतक है। आयताकार की सही पहचान के कारण, व्यापारी सफलतापूर्वक बाजार में प्रवेश कर सकता है।
रेक्टैंगल पॅटर्न तकनीकी विश्लेषण में उपयोग किए जाने वाले सबसे लोकप्रिय और आसान पैटर्न में से एक है। हालांकि एक साधारण पैटर्न होने के नाते, यह एक महत्वपूर्ण और मजबूत आंकड़ा है जो एक प्रवृत्ति निरंतरता का एक बहुत ही स्पष्ट संकेत है। इसे ध्यान में रखते हुए, एक व्यापारी को संभावित रूप से लाभदायक आदेश देने का अवसर मिलता है।
पैटर्न तकनीकी विश्लेषण के एक और आंकड़े के समान दिखता है - ध्वज। हालांकि, आयत में क्षैतिज समर्थन और प्रतिरोध रेखाएं हैं, और इसमें कोई झंडा नहीं है। कीमतें दो समांतर रेखाओं के बीच पैटर्न के अंदर स्थानांतरित होती हैं। आकृति को पूरा करने के लिए दो लंबवत रेखाएं खींची जा सकती हैं, लेकिन यह आवश्यक नहीं है क्योंकि वे कोई महत्वपूर्ण भूमिका निभाते हैं।
मौलिक घटकों पर ध्यान देना महत्वपूर्ण है। आयताकार का गठन अक्सर कुछ महत्वपूर्ण समाचारों के प्रकाशन से पहले होता है जिसके परिणामस्वरूप भविष्यवाणी की जा सकती है। यदि प्रकाशित डेटा पूर्वानुमान के साथ मेल खाता है, तो कीमतें आमतौर पर पिछले पूर्वाग्रह के साथ बढ़ती हैं।
यह अक्सर होता है कि कीमतें पिछले प्रवृत्ति की दिशा में टूट जाती हैं। यही कारण है कि आयताकार निरंतर पैटर्न के रूप में परिभाषित किया गया है। हालांकि, कभी-कभी कीमतें पैटर्न को तोड़ती हैं और विपरीत दिशा में जाती हैं। उस मामले में आयताकार एक उलटा पैटर्न बन जाता है। यह समष्टि आर्थिक आंकड़ों के पूर्वानुमान के बाद नहीं हो सकता है।
चार्ट पर आयत को अलग करना काफी आसान है। यह एक छोटे से व्यापार चैनल या एक किनारे की प्रवृत्ति के रूप में दिखता है। आंकड़ा इंगित करता है कि भालू और बैल समानता तक पहुंचे। एक समर्थन या प्रतिरोध रेखा टूट जाती है, आयताकार एक प्रवृत्ति की निरंतरता संकेत करता है।
यदि आयताकार बाजार में आयताकार दिखाई देता है, तो कीमतें ऊपर की ओर टूट जाती हैं और इस तरह के एक आंकड़े को बुलिश आयताकार कहा जाता है। यदि यह मंदी के बाजार में होता है और कीमतें नीचे तोड़ती हैं, तो आंकड़े को मंदी का आयत कहा जाता है।
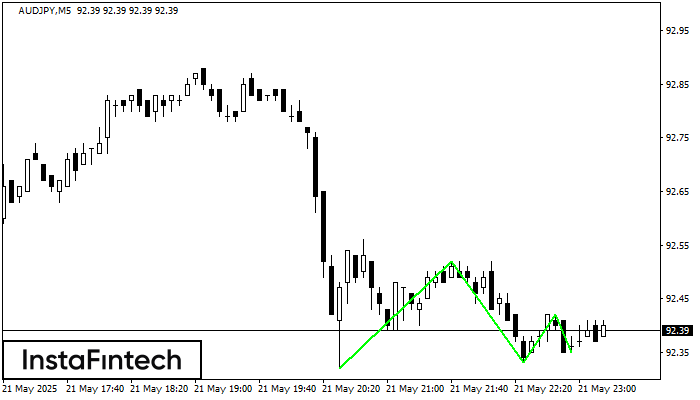
The Triple Bottom pattern has formed on the chart of AUDJPY M5. Features of the pattern: The lower line of the pattern has coordinates 92.52 with the upper limit 92.52/92.42
The M5 and M15 time frames may have more false entry points.
Open chart in a new window
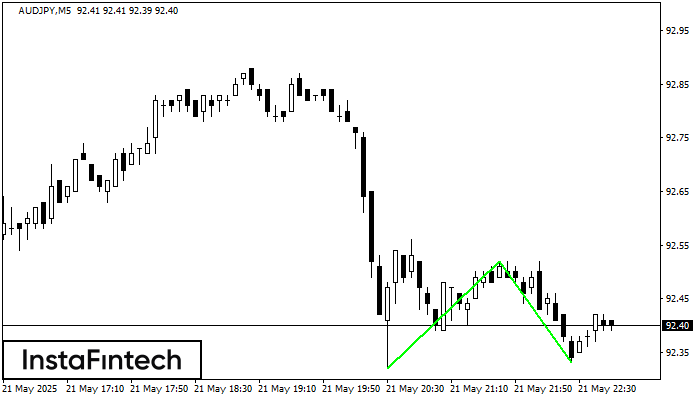
The Double Bottom pattern has been formed on AUDJPY M5; the upper boundary is 92.52; the lower boundary is 92.33. The width of the pattern is 20 points. In case
The M5 and M15 time frames may have more false entry points.
Open chart in a new window
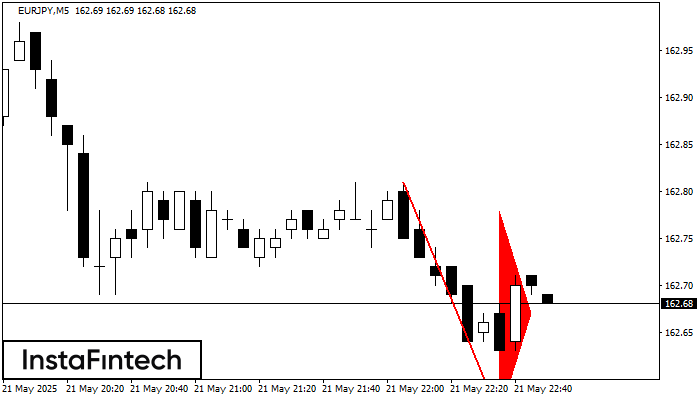
The Bearish pennant pattern has formed on the EURJPY M5 chart. This pattern type is characterized by a slight slowdown after which the price will move in the direction
The M5 and M15 time frames may have more false entry points.
Open chart in a new window Our new app for your convenient and fast verification


Your IP address shows that you are currently located in the USA. If you are a resident of the United States, you are prohibited from using the services of InstaFintech Group including online trading, online transfers, deposit/withdrawal of funds, etc.
If you think you are seeing this message by mistake and your location is not the US, kindly proceed to the website. Otherwise, you must leave the website in order to comply with government restrictions.
Why does your IP address show your location as the USA?
Please confirm whether you are a US resident or not by clicking the relevant button below. If you choose the wrong option, being a US resident, you will not be able to open an account with InstaTrade anyway.
We are sorry for any inconvenience caused by this message.