

वास्तविक पैटर्न

पैटर्न ग्राफिकल मॉडल हैं जो चार्ट में मूल्य से बने होते हैं। तकनीकी विश्लेषण भविष्यवाणियों में से एक के अनुसार, इतिहास का मतलब मूल्य आंदोलन खुद को दोहराता है। इसका मतलब है कि मूल्य आंदोलन अक्सर एक ही परिस्थितियों में समान होते हैं जो उच्च संभावना के साथ स्थिति के आगे के विकास की भविष्यवाणी करना संभव बनाता है।
इंस्टा फॉरेक्स द्वारा प्रासंगिक पैटर्न एक उपयोग में आसान सेवा है जो आपको बाजार में नवीनतम परिवर्तनों के बारे में जागरूक होने और समय पर बाजार से संकेतों पर प्रतिक्रिया करने की अनुमति देती है। हमारी सेवा में आप हमेशा किसी भी जोड़ी और किसी भी समय सीमा पर नवीनतम और सबसे प्रासंगिक पैटर्न प्राप्त कर सकते हैं.
Bullish Symmetrical Triangle
was formed on 22.04 at 00:30:42 (UTC+0)
signal strength 1 of 5

According to the chart of M5, AUDCAD formed the Bullish Symmetrical Triangle pattern. Description: This is the pattern of a trend continuation. 0.8879 and 0.8869 are the coordinates of the upper and lower borders respectively. The pattern width is measured on the chart at 10 pips. Outlook: If the upper border 0.8879 is broken, the price is likely to continue its move by 0.8889.
The M5 and M15 time frames may have more false entry points.
- All
- All
- Bearish Rectangle
- Bearish Symmetrical Triangle
- Bearish Symmetrical Triangle
- Bullish Rectangle
- Double Top
- Double Top
- Triple Bottom
- Triple Bottom
- Triple Top
- Triple Top
- All
- All
- Buy
- Sale
- All
- 1
- 2
- 3
- 4
- 5
डबल बॉटम
was formed on 22.05 at 17:45:33 (UTC+0)
signal strength 2 of 5
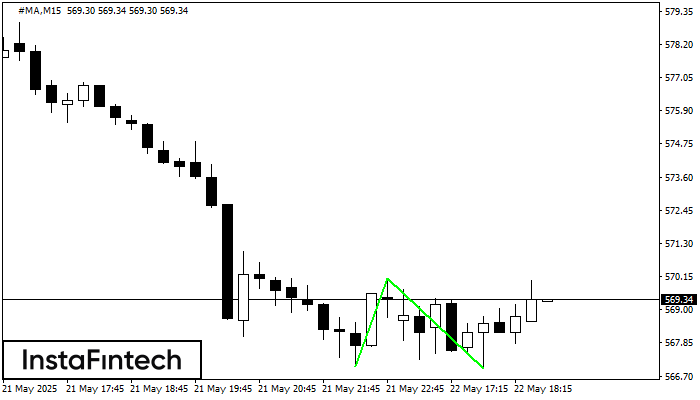
डबल बॉटम पैटर्न #MA M15 पर बना है। यह फॉर्मेशन नीचे से ऊपर की ओर प्रवृत्ति के उलट होने का संकेत देता है। संकेत यह है कि पैटर्न 570.10 की
M5 और M15 समय सीमा में अधिक फाल्स एंट्री पॉइंट्स हो सकते हैं।
Open chart in a new window
डबल टॉप
was formed on 22.05 at 17:30:27 (UTC+0)
signal strength 1 of 5
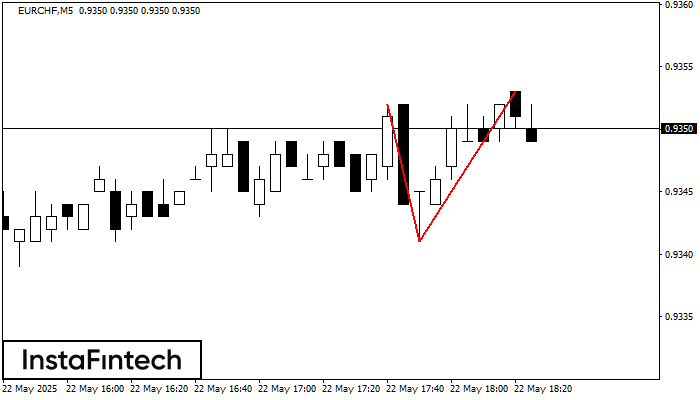
EURCHF M5 पर डबल टॉप रीवर्सल पैटर्न बना है। विशेषताएं: ऊपरी सीमा 0.9352; निचली सीमा 0.9341; पैटर्न की चौड़ाई 12 पॉइंट्स है। सेल ट्रेडों को 0.9341 की निचली सीमा के
M5 और M15 समय सीमा में अधिक फाल्स एंट्री पॉइंट्स हो सकते हैं।
Open chart in a new window
हेड एण्ड शोल्डर्स
was formed on 22.05 at 17:00:26 (UTC+0)
signal strength 4 of 5
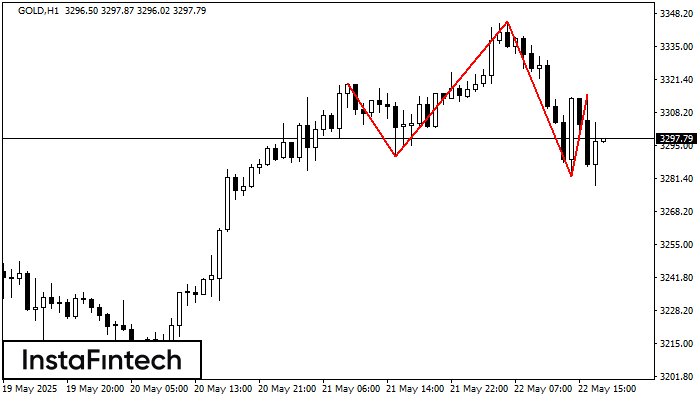
GOLD H1 ने निम्न विशेषताओं के साथ हेड एण्ड शोल्डर्स पैटर्न का गठन किया: हेड का टॉप 3344.99 पर है, नेकलाइन और ऊपर का कोण 3290.48/3282.56 पर है। इस पैटर्न
Open chart in a new window


