

वास्तविक पैटर्न

पैटर्न ग्राफिकल मॉडल हैं जो चार्ट में मूल्य से बने होते हैं। तकनीकी विश्लेषण भविष्यवाणियों में से एक के अनुसार, इतिहास का मतलब मूल्य आंदोलन खुद को दोहराता है। इसका मतलब है कि मूल्य आंदोलन अक्सर एक ही परिस्थितियों में समान होते हैं जो उच्च संभावना के साथ स्थिति के आगे के विकास की भविष्यवाणी करना संभव बनाता है।
इंस्टा फॉरेक्स द्वारा प्रासंगिक पैटर्न एक उपयोग में आसान सेवा है जो आपको बाजार में नवीनतम परिवर्तनों के बारे में जागरूक होने और समय पर बाजार से संकेतों पर प्रतिक्रिया करने की अनुमति देती है। हमारी सेवा में आप हमेशा किसी भी जोड़ी और किसी भी समय सीमा पर नवीनतम और सबसे प्रासंगिक पैटर्न प्राप्त कर सकते हैं.
Bearish pennant
was formed on 21.04 at 16:59:58 (UTC+0)
signal strength 2 of 5
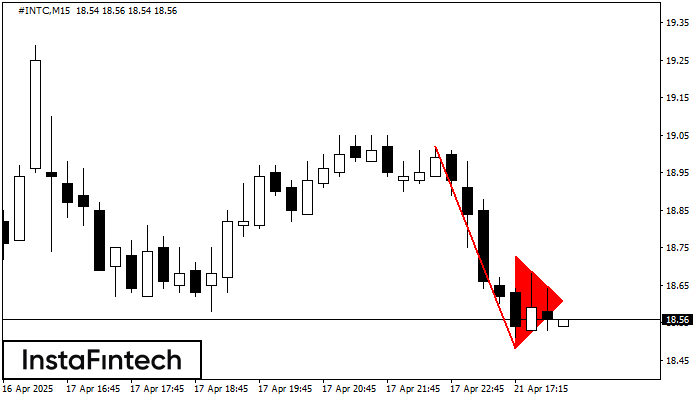
The Bearish pennant pattern has formed on the #INTC M15 chart. This pattern type is characterized by a slight slowdown after which the price will move in the direction of the original trend. In case the price fixes below the pattern’s low of 18.48, a trader will be able to successfully enter the sell position.
The M5 and M15 time frames may have more false entry points.
- All
- All
- Bearish Rectangle
- Bearish Symmetrical Triangle
- Bearish Symmetrical Triangle
- Bullish Rectangle
- Double Top
- Double Top
- Triple Bottom
- Triple Bottom
- Triple Top
- Triple Top
- All
- All
- Buy
- Sale
- All
- 1
- 2
- 3
- 4
- 5
Двойная вершина
сформирован 23.05 в 13:15:25 (UTC+0)
сила сигнала 1 из 5
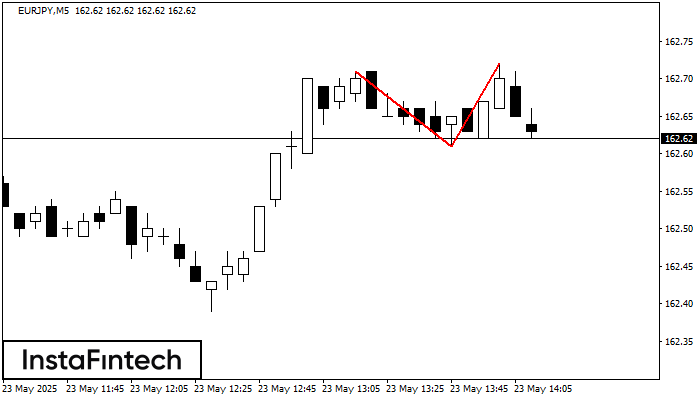
По EURJPY на M5 сформировалась разворотная фигура «Двойная вершина». Характеристика: Верхняя граница 162.71; Нижняя граница 162.61; Ширина фигуры 11 пунктов. Позицию на продажу возможно открыть ниже нижней границы 162.61
Таймфреймы М5 и М15 могут иметь больше ложных точек входа.
Открыть график инструмента в новом окне
Двойная вершина
сформирован 23.05 в 13:10:13 (UTC+0)
сила сигнала 1 из 5
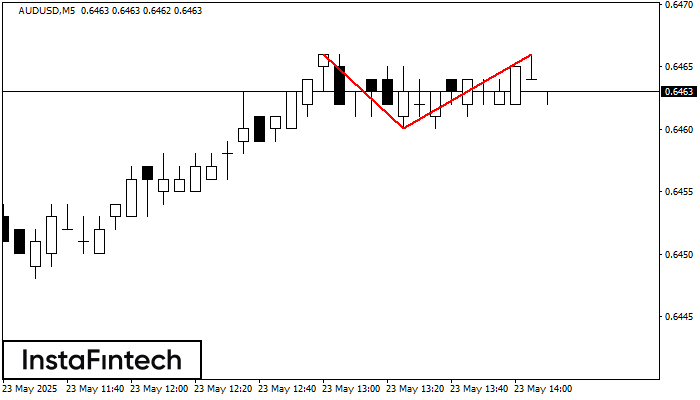
По AUDUSD на M5 сформировалась разворотная фигура «Двойная вершина». Характеристика: Верхняя граница 0.6466; Нижняя граница 0.6460; Ширина фигуры 6 пунктов. Позицию на продажу возможно открыть ниже нижней границы 0.6460
Таймфреймы М5 и М15 могут иметь больше ложных точек входа.
Открыть график инструмента в новом окне
Двойное дно
сформирован 23.05 в 12:59:46 (UTC+0)
сила сигнала 2 из 5
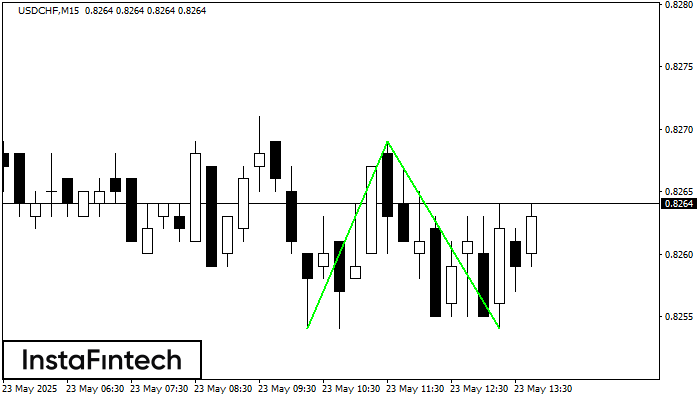
Сформирована фигура «Двойное дно» на графике USDCHF M15. Характеристика: Уровень поддержки 0.8254; Уровень сопротивления 0.8269; Ширина фигуры 15 пунктов. В случае пробоя уровня сопротивления можно будет прогнозировать изменение тенденции
Таймфреймы М5 и М15 могут иметь больше ложных точек входа.
Открыть график инструмента в новом окне


