

वास्तविक पैटर्न

पैटर्न ग्राफिकल मॉडल हैं जो चार्ट में मूल्य से बने होते हैं। तकनीकी विश्लेषण भविष्यवाणियों में से एक के अनुसार, इतिहास का मतलब मूल्य आंदोलन खुद को दोहराता है। इसका मतलब है कि मूल्य आंदोलन अक्सर एक ही परिस्थितियों में समान होते हैं जो उच्च संभावना के साथ स्थिति के आगे के विकास की भविष्यवाणी करना संभव बनाता है।
इंस्टा फॉरेक्स द्वारा प्रासंगिक पैटर्न एक उपयोग में आसान सेवा है जो आपको बाजार में नवीनतम परिवर्तनों के बारे में जागरूक होने और समय पर बाजार से संकेतों पर प्रतिक्रिया करने की अनुमति देती है। हमारी सेवा में आप हमेशा किसी भी जोड़ी और किसी भी समय सीमा पर नवीनतम और सबसे प्रासंगिक पैटर्न प्राप्त कर सकते हैं.
Bearish pennant
was formed on 21.04 at 16:59:49 (UTC+0)
signal strength 2 of 5
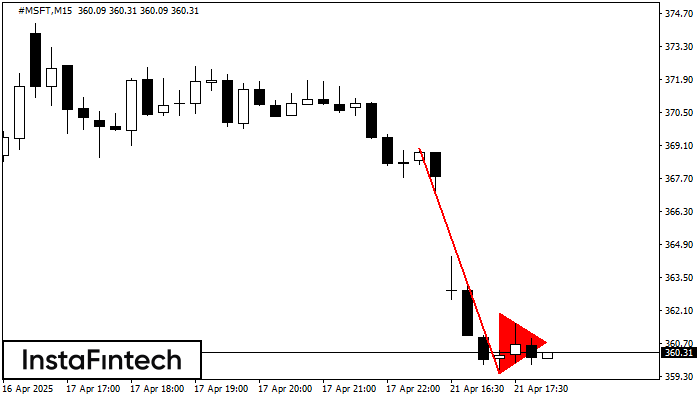
The Bearish pennant pattern has formed on the #MSFT M15 chart. The pattern signals continuation of the downtrend in case the pennant’s low of 359.45 is broken through. Recommendations: Place the sell stop pending order 10 pips below the pattern’s low. Place the take profit order at the projection distance of the flagpole height.
The M5 and M15 time frames may have more false entry points.
See Also
- All
- All
- Bearish Rectangle
- Bearish Symmetrical Triangle
- Bearish Symmetrical Triangle
- Bullish Rectangle
- Double Top
- Double Top
- Triple Bottom
- Triple Bottom
- Triple Top
- Triple Top
- All
- All
- Buy
- Sale
- All
- 1
- 2
- 3
- 4
- 5
डबल बॉटम
was formed on 22.05 at 15:15:29 (UTC+0)
signal strength 2 of 5
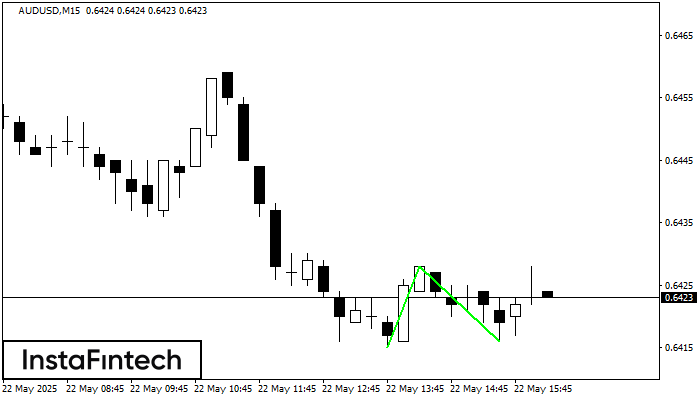
डबल बॉटम पैटर्न AUDUSD M15 पर बना है। यह फॉर्मेशन नीचे से ऊपर की ओर प्रवृत्ति के उलट होने का संकेत देता है। संकेत यह है कि पैटर्न 0.6428 की
M5 और M15 समय सीमा में अधिक फाल्स एंट्री पॉइंट्स हो सकते हैं।
Open chart in a new window
डबल बॉटम
was formed on 22.05 at 15:00:08 (UTC+0)
signal strength 2 of 5
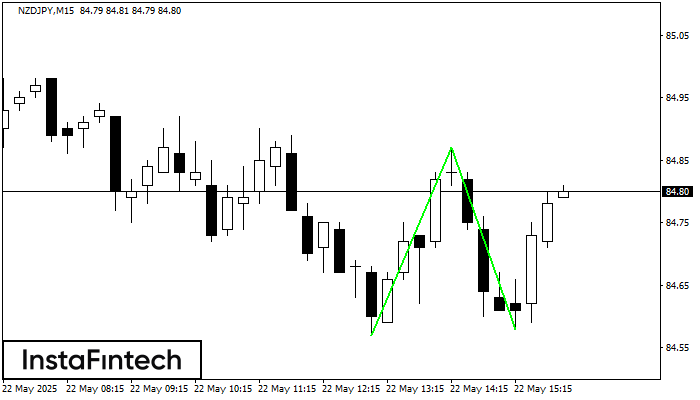
डबल बॉटम पैटर्न NZDJPY M15 पर बना है। विशेषताएं: समर्थन स्तर 84.57; प्रतिरोध स्तर 84.87; पैटर्न की चौड़ाई 30 पॉइंट्स। यदि प्रतिरोध स्तर टूट जाता है, तो रुझान में बदलाव
M5 और M15 समय सीमा में अधिक फाल्स एंट्री पॉइंट्स हो सकते हैं।
Open chart in a new window
डबल बॉटम
was formed on 22.05 at 14:45:52 (UTC+0)
signal strength 2 of 5
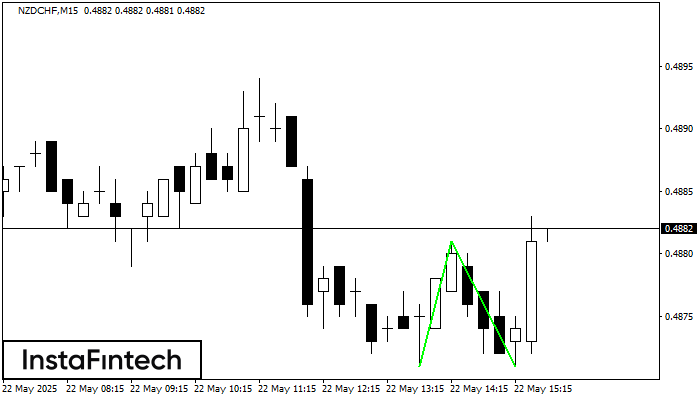
डबल बॉटम पैटर्न NZDCHF M15 पर बना है; ऊपरी सीमा 0.4881 है; निचली सीमा 0.4871 है। पैटर्न की चौड़ाई 10 अंक है। ऊपरी सीमा 0.4881 के टूटने के मामले में
M5 और M15 समय सीमा में अधिक फाल्स एंट्री पॉइंट्स हो सकते हैं।
Open chart in a new window


