

वास्तविक पैटर्न

पैटर्न ग्राफिकल मॉडल हैं जो चार्ट में मूल्य से बने होते हैं। तकनीकी विश्लेषण भविष्यवाणियों में से एक के अनुसार, इतिहास का मतलब मूल्य आंदोलन खुद को दोहराता है। इसका मतलब है कि मूल्य आंदोलन अक्सर एक ही परिस्थितियों में समान होते हैं जो उच्च संभावना के साथ स्थिति के आगे के विकास की भविष्यवाणी करना संभव बनाता है।
इंस्टा फॉरेक्स द्वारा प्रासंगिक पैटर्न एक उपयोग में आसान सेवा है जो आपको बाजार में नवीनतम परिवर्तनों के बारे में जागरूक होने और समय पर बाजार से संकेतों पर प्रतिक्रिया करने की अनुमति देती है। हमारी सेवा में आप हमेशा किसी भी जोड़ी और किसी भी समय सीमा पर नवीनतम और सबसे प्रासंगिक पैटर्न प्राप्त कर सकते हैं.
Bullish Symmetrical Triangle
was formed on 16.04 at 05:26:29 (UTC+0)
signal strength 1 of 5
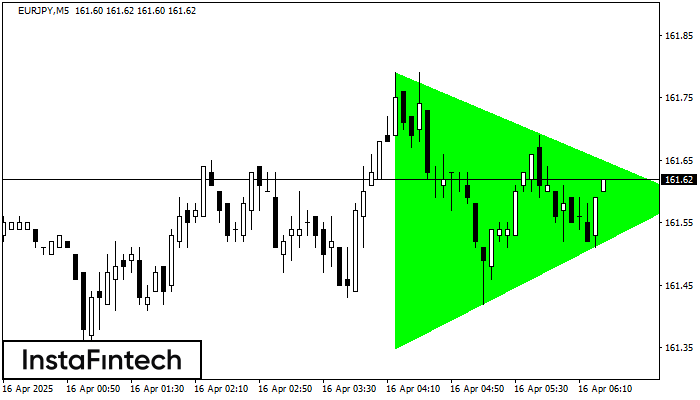
According to the chart of M5, EURJPY formed the Bullish Symmetrical Triangle pattern. The lower border of the pattern touches the coordinates 161.35/161.59 whereas the upper border goes across 161.79/161.59. If the Bullish Symmetrical Triangle pattern is in progress, this evidently signals a further upward trend. In other words, in case the scenario comes true, the price of EURJPY will breach the upper border to head for 161.74.
The M5 and M15 time frames may have more false entry points.
- All
- All
- Bearish Rectangle
- Bearish Symmetrical Triangle
- Bearish Symmetrical Triangle
- Bullish Rectangle
- Double Top
- Double Top
- Triple Bottom
- Triple Bottom
- Triple Top
- Triple Top
- All
- All
- Buy
- Sale
- All
- 1
- 2
- 3
- 4
- 5
डबल टॉप
was formed on 29.05 at 07:06:52 (UTC+0)
signal strength 1 of 5
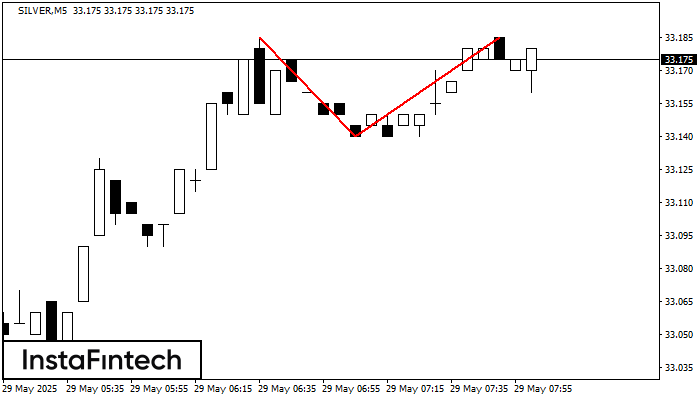
SILVER M5 पर डबल टॉप रीवर्सल पैटर्न बना है। विशेषताएं: ऊपरी सीमा 33.19; निचली सीमा 33.14; पैटर्न की चौड़ाई 45 पॉइंट्स है। सेल ट्रेडों को 33.14 की निचली सीमा के
M5 और M15 समय सीमा में अधिक फाल्स एंट्री पॉइंट्स हो सकते हैं।
Open chart in a new window
डबल बॉटम
was formed on 29.05 at 05:19:51 (UTC+0)
signal strength 1 of 5
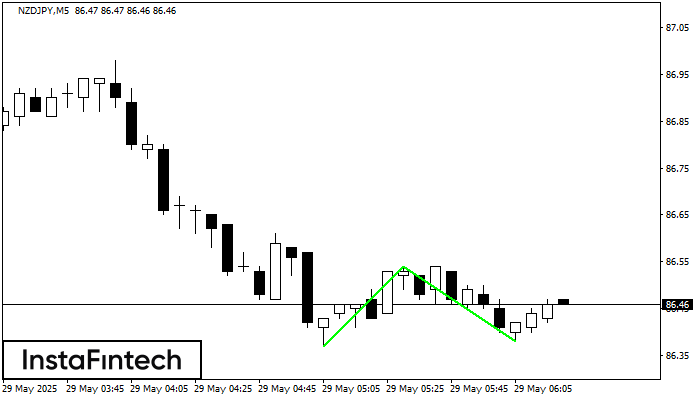
डबल बॉटम पैटर्न NZDJPY M5 पर बना है। विशेषताएं: समर्थन स्तर 86.37; प्रतिरोध स्तर 86.54; पैटर्न की चौड़ाई 17 पॉइंट्स। यदि प्रतिरोध स्तर टूट जाता है, तो रुझान में बदलाव
M5 और M15 समय सीमा में अधिक फाल्स एंट्री पॉइंट्स हो सकते हैं।
Open chart in a new window
डबल टॉप
was formed on 29.05 at 03:41:06 (UTC+0)
signal strength 1 of 5
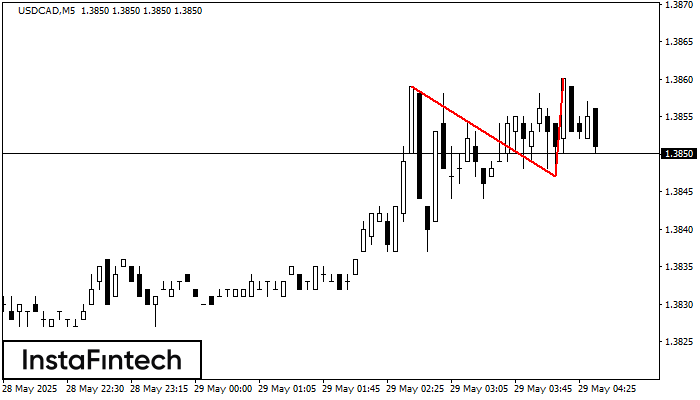
USDCAD M5 पर डबल टॉप रीवर्सल पैटर्न बना है। विशेषताएं: ऊपरी सीमा 1.3859; निचली सीमा 1.3847; पैटर्न की चौड़ाई 13 पॉइंट्स है। सेल ट्रेडों को 1.3847 की निचली सीमा के
M5 और M15 समय सीमा में अधिक फाल्स एंट्री पॉइंट्स हो सकते हैं।
Open chart in a new window


