

वास्तविक पैटर्न

पैटर्न ग्राफिकल मॉडल हैं जो चार्ट में मूल्य से बने होते हैं। तकनीकी विश्लेषण भविष्यवाणियों में से एक के अनुसार, इतिहास का मतलब मूल्य आंदोलन खुद को दोहराता है। इसका मतलब है कि मूल्य आंदोलन अक्सर एक ही परिस्थितियों में समान होते हैं जो उच्च संभावना के साथ स्थिति के आगे के विकास की भविष्यवाणी करना संभव बनाता है।
इंस्टा फॉरेक्स द्वारा प्रासंगिक पैटर्न एक उपयोग में आसान सेवा है जो आपको बाजार में नवीनतम परिवर्तनों के बारे में जागरूक होने और समय पर बाजार से संकेतों पर प्रतिक्रिया करने की अनुमति देती है। हमारी सेवा में आप हमेशा किसी भी जोड़ी और किसी भी समय सीमा पर नवीनतम और सबसे प्रासंगिक पैटर्न प्राप्त कर सकते हैं.
Double Bottom
was formed on 16.04 at 05:15:27 (UTC+0)
signal strength 1 of 5
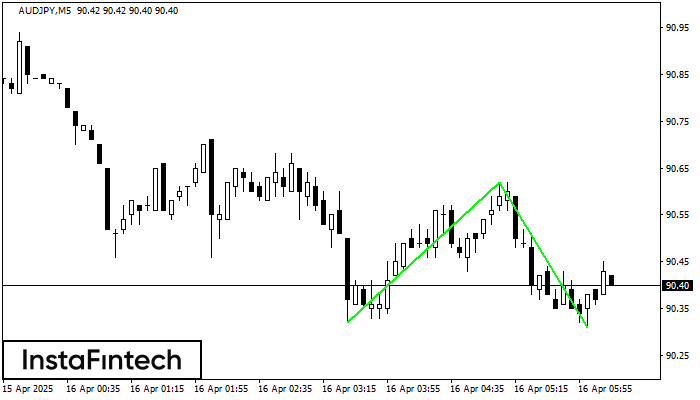
The Double Bottom pattern has been formed on AUDJPY M5. Characteristics: the support level 90.32; the resistance level 90.62; the width of the pattern 30 points. If the resistance level is broken, a change in the trend can be predicted with the first target point lying at the distance of 31 points.
The M5 and M15 time frames may have more false entry points.
See Also
- All
- All
- Bearish Rectangle
- Bearish Symmetrical Triangle
- Bearish Symmetrical Triangle
- Bullish Rectangle
- Double Top
- Double Top
- Triple Bottom
- Triple Bottom
- Triple Top
- Triple Top
- All
- All
- Buy
- Sale
- All
- 1
- 2
- 3
- 4
- 5
Triple Top
was formed on 28.05 at 03:01:28 (UTC+0)
signal strength 3 of 5
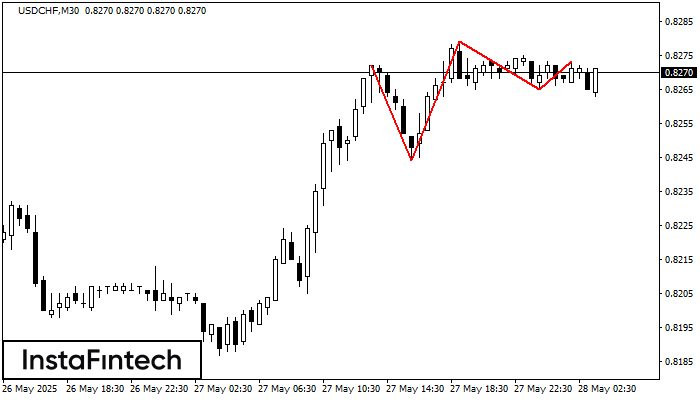
The Triple Top pattern has formed on the chart of the USDCHF M30 trading instrument. It is a reversal pattern featuring the following characteristics: resistance level -1, support level -21
Open chart in a new window
Triple Bottom
was formed on 28.05 at 03:00:31 (UTC+0)
signal strength 2 of 5
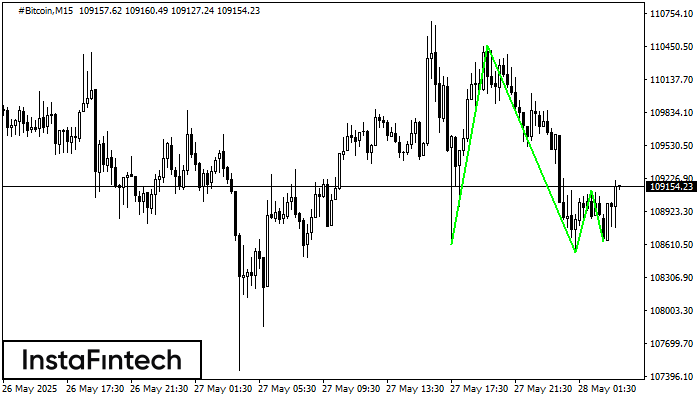
The Triple Bottom pattern has formed on the chart of #Bitcoin M15. Features of the pattern: The lower line of the pattern has coordinates 110459.83 with the upper limit 110459.83/109114.84
The M5 and M15 time frames may have more false entry points.
Open chart in a new window
Triple Top
was formed on 28.05 at 02:41:05 (UTC+0)
signal strength 1 of 5
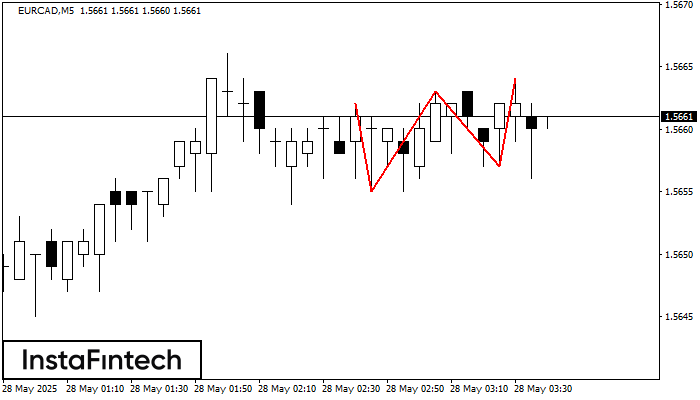
On the chart of the EURCAD M5 trading instrument, the Triple Top pattern that signals a trend change has formed. It is possible that after formation of the third peak
The M5 and M15 time frames may have more false entry points.
Open chart in a new window


