

वास्तविक पैटर्न

पैटर्न ग्राफिकल मॉडल हैं जो चार्ट में मूल्य से बने होते हैं। तकनीकी विश्लेषण भविष्यवाणियों में से एक के अनुसार, इतिहास का मतलब मूल्य आंदोलन खुद को दोहराता है। इसका मतलब है कि मूल्य आंदोलन अक्सर एक ही परिस्थितियों में समान होते हैं जो उच्च संभावना के साथ स्थिति के आगे के विकास की भविष्यवाणी करना संभव बनाता है।
इंस्टा फॉरेक्स द्वारा प्रासंगिक पैटर्न एक उपयोग में आसान सेवा है जो आपको बाजार में नवीनतम परिवर्तनों के बारे में जागरूक होने और समय पर बाजार से संकेतों पर प्रतिक्रिया करने की अनुमति देती है। हमारी सेवा में आप हमेशा किसी भी जोड़ी और किसी भी समय सीमा पर नवीनतम और सबसे प्रासंगिक पैटर्न प्राप्त कर सकते हैं.
Double Bottom
was formed on 16.04 at 00:35:20 (UTC+0)
signal strength 1 of 5

The Double Bottom pattern has been formed on #Bitcoin M5; the upper boundary is 84198.05; the lower boundary is 83772.49. The width of the pattern is 43677 points. In case of a break of the upper boundary 84198.05, a change in the trend can be predicted where the width of the pattern will coincide with the distance to a possible take profit level.
The M5 and M15 time frames may have more false entry points.
See Also
- All
- All
- Bearish Rectangle
- Bearish Symmetrical Triangle
- Bearish Symmetrical Triangle
- Bullish Rectangle
- Double Top
- Double Top
- Triple Bottom
- Triple Bottom
- Triple Top
- Triple Top
- All
- All
- Buy
- Sale
- All
- 1
- 2
- 3
- 4
- 5
Bullish Flag
was formed on 29.05 at 01:05:37 (UTC+0)
signal strength 1 of 5
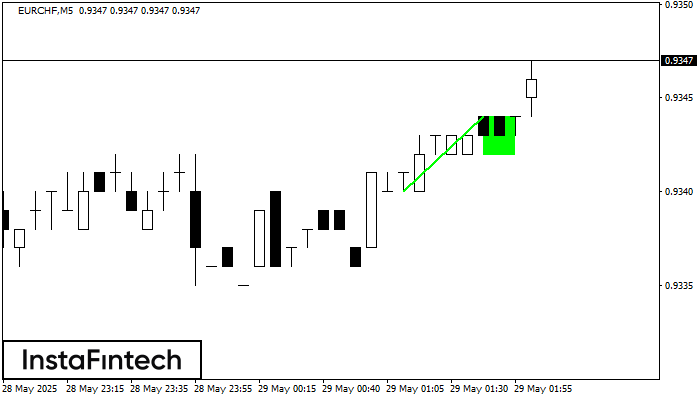
The Bullish Flag pattern has been formed on the chart EURCHF M5 which signals that the upward trend will continue. Signals: а break of the peak at 0.9344 may push
The M5 and M15 time frames may have more false entry points.
Open chart in a new window
Bearish Rectangle
was formed on 29.05 at 01:02:33 (UTC+0)
signal strength 2 of 5
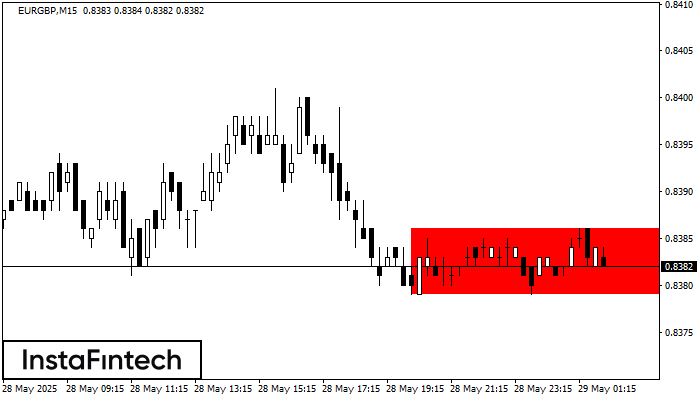
According to the chart of M15, EURGBP formed the Bearish Rectangle. This type of a pattern indicates a trend continuation. It consists of two levels: resistance 0.8386 - 0.0000
The M5 and M15 time frames may have more false entry points.
Open chart in a new window
Double Bottom
was formed on 29.05 at 00:31:19 (UTC+0)
signal strength 3 of 5
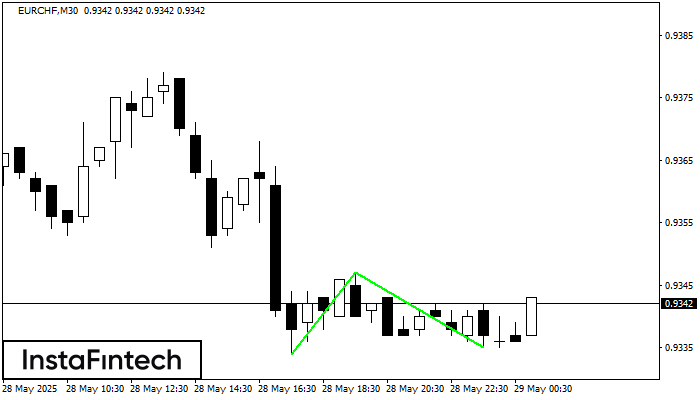
The Double Bottom pattern has been formed on EURCHF M30; the upper boundary is 0.9347; the lower boundary is 0.9335. The width of the pattern is 13 points. In case
Open chart in a new window


