

वास्तविक पैटर्न

पैटर्न ग्राफिकल मॉडल हैं जो चार्ट में मूल्य से बने होते हैं। तकनीकी विश्लेषण भविष्यवाणियों में से एक के अनुसार, इतिहास का मतलब मूल्य आंदोलन खुद को दोहराता है। इसका मतलब है कि मूल्य आंदोलन अक्सर एक ही परिस्थितियों में समान होते हैं जो उच्च संभावना के साथ स्थिति के आगे के विकास की भविष्यवाणी करना संभव बनाता है।
इंस्टा फॉरेक्स द्वारा प्रासंगिक पैटर्न एक उपयोग में आसान सेवा है जो आपको बाजार में नवीनतम परिवर्तनों के बारे में जागरूक होने और समय पर बाजार से संकेतों पर प्रतिक्रिया करने की अनुमति देती है। हमारी सेवा में आप हमेशा किसी भी जोड़ी और किसी भी समय सीमा पर नवीनतम और सबसे प्रासंगिक पैटर्न प्राप्त कर सकते हैं.
Double Bottom
was formed on 15.04 at 21:15:27 (UTC+0)
signal strength 2 of 5
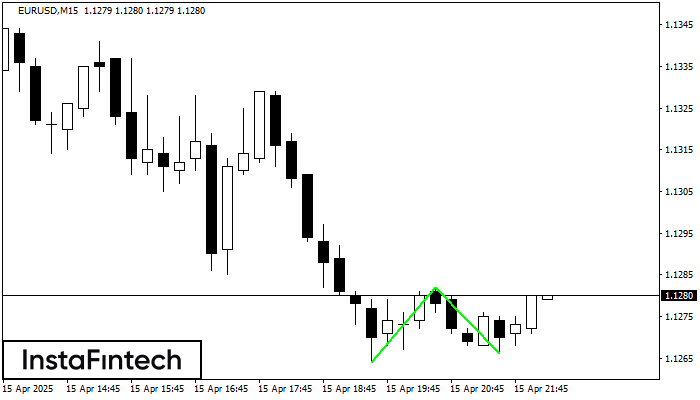
The Double Bottom pattern has been formed on EURUSD M15. Characteristics: the support level 1.1264; the resistance level 1.1282; the width of the pattern 18 points. If the resistance level is broken, a change in the trend can be predicted with the first target point lying at the distance of 16 points.
The M5 and M15 time frames may have more false entry points.
- All
- All
- Bearish Rectangle
- Bearish Symmetrical Triangle
- Bearish Symmetrical Triangle
- Bullish Rectangle
- Double Top
- Double Top
- Triple Bottom
- Triple Bottom
- Triple Top
- Triple Top
- All
- All
- Buy
- Sale
- All
- 1
- 2
- 3
- 4
- 5
Bearish Rectangle
was formed on 27.05 at 22:51:51 (UTC+0)
signal strength 3 of 5
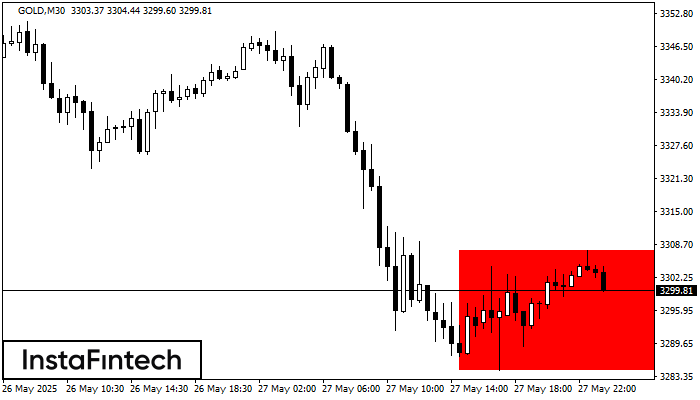
According to the chart of M30, GOLD formed the Bearish Rectangle which is a pattern of a trend continuation. The pattern is contained within the following borders: lower border 3284.62
Open chart in a new window
Double Bottom
was formed on 27.05 at 22:50:17 (UTC+0)
signal strength 1 of 5
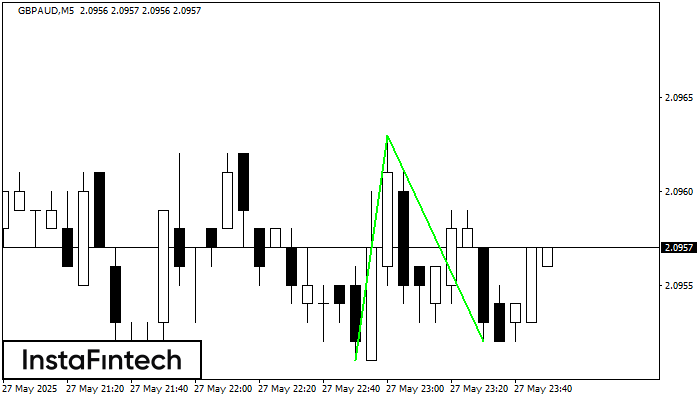
The Double Bottom pattern has been formed on GBPAUD M5; the upper boundary is 2.0963; the lower boundary is 2.0952. The width of the pattern is 12 points. In case
The M5 and M15 time frames may have more false entry points.
Open chart in a new window
Triple Bottom
was formed on 27.05 at 22:10:53 (UTC+0)
signal strength 1 of 5
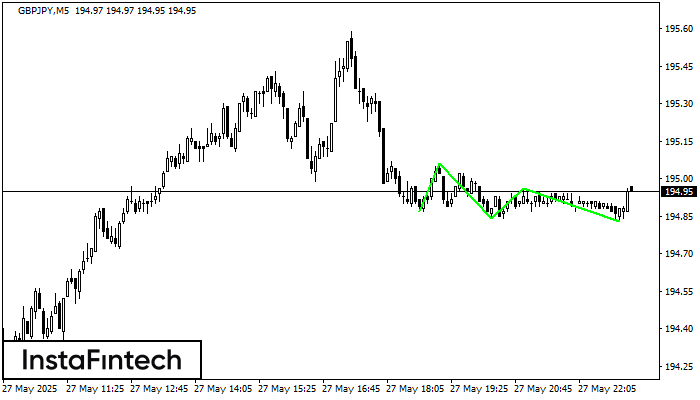
The Triple Bottom pattern has formed on the chart of the GBPJPY M5 trading instrument. The pattern signals a change in the trend from downwards to upwards in the case
The M5 and M15 time frames may have more false entry points.
Open chart in a new window


