

वास्तविक पैटर्न

पैटर्न ग्राफिकल मॉडल हैं जो चार्ट में मूल्य से बने होते हैं। तकनीकी विश्लेषण भविष्यवाणियों में से एक के अनुसार, इतिहास का मतलब मूल्य आंदोलन खुद को दोहराता है। इसका मतलब है कि मूल्य आंदोलन अक्सर एक ही परिस्थितियों में समान होते हैं जो उच्च संभावना के साथ स्थिति के आगे के विकास की भविष्यवाणी करना संभव बनाता है।
इंस्टा फॉरेक्स द्वारा प्रासंगिक पैटर्न एक उपयोग में आसान सेवा है जो आपको बाजार में नवीनतम परिवर्तनों के बारे में जागरूक होने और समय पर बाजार से संकेतों पर प्रतिक्रिया करने की अनुमति देती है। हमारी सेवा में आप हमेशा किसी भी जोड़ी और किसी भी समय सीमा पर नवीनतम और सबसे प्रासंगिक पैटर्न प्राप्त कर सकते हैं.
Inverse Head and Shoulder
was formed on 15.04 at 20:00:17 (UTC+0)
signal strength 3 of 5

According to the chart of M30, EURCHF formed the Inverse Head and Shoulder pattern. The Head’s top is set at 0.9269 while the median line of the Neck is found at 0.9229/0.9253. The formation of the Inverse Head and Shoulder pattern evidently signals a reversal of the downward trend. In other words, in case the scenario comes true, the price of EURCHF will go towards 0.9299
- All
- All
- Bearish Rectangle
- Bearish Symmetrical Triangle
- Bearish Symmetrical Triangle
- Bullish Rectangle
- Double Top
- Double Top
- Triple Bottom
- Triple Bottom
- Triple Top
- Triple Top
- All
- All
- Buy
- Sale
- All
- 1
- 2
- 3
- 4
- 5
Bearish pennant
сформирован 26.05 в 00:19:29 (UTC+0)
сила сигнала 1 из 5
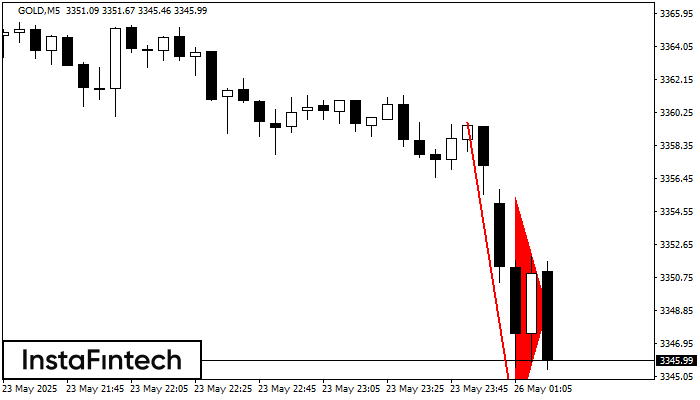
The Bearish pennant pattern has formed on the GOLD M5 chart. The pattern signals continuation of the downtrend in case the pennant’s low of 3342.42 is broken through. Recommendations: Place
The M5 and M15 time frames may have more false entry points.
Открыть график инструмента в новом окне
Bullish Rectangle
сформирован 25.05 в 23:51:24 (UTC+0)
сила сигнала 1 из 5
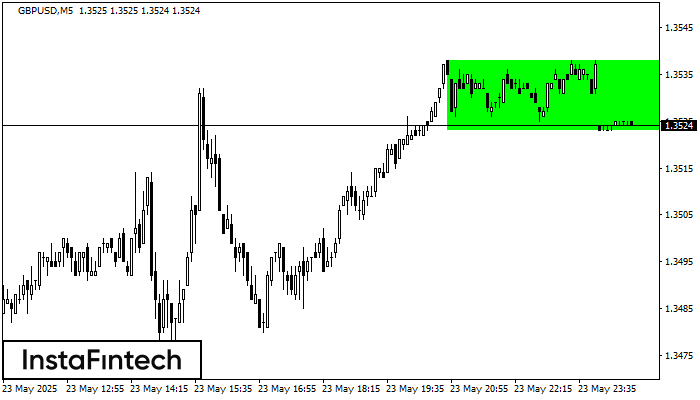
According to the chart of M5, GBPUSD formed the Bullish Rectangle which is a pattern of a trend continuation. The pattern is contained within the following borders: the lower border
The M5 and M15 time frames may have more false entry points.
Открыть график инструмента в новом окне
Double Bottom
сформирован 25.05 в 23:50:54 (UTC+0)
сила сигнала 2 из 5
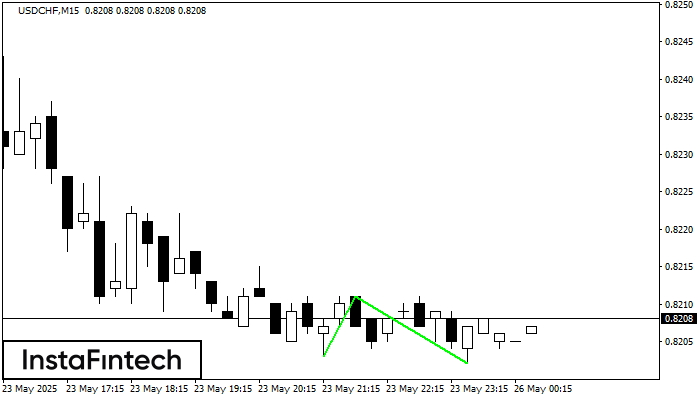
The Double Bottom pattern has been formed on USDCHF M15; the upper boundary is 0.8211; the lower boundary is 0.8202. The width of the pattern is 8 points. In case
The M5 and M15 time frames may have more false entry points.
Открыть график инструмента в новом окне


