

वास्तविक पैटर्न

पैटर्न ग्राफिकल मॉडल हैं जो चार्ट में मूल्य से बने होते हैं। तकनीकी विश्लेषण भविष्यवाणियों में से एक के अनुसार, इतिहास का मतलब मूल्य आंदोलन खुद को दोहराता है। इसका मतलब है कि मूल्य आंदोलन अक्सर एक ही परिस्थितियों में समान होते हैं जो उच्च संभावना के साथ स्थिति के आगे के विकास की भविष्यवाणी करना संभव बनाता है।
इंस्टा फॉरेक्स द्वारा प्रासंगिक पैटर्न एक उपयोग में आसान सेवा है जो आपको बाजार में नवीनतम परिवर्तनों के बारे में जागरूक होने और समय पर बाजार से संकेतों पर प्रतिक्रिया करने की अनुमति देती है। हमारी सेवा में आप हमेशा किसी भी जोड़ी और किसी भी समय सीमा पर नवीनतम और सबसे प्रासंगिक पैटर्न प्राप्त कर सकते हैं.
Head and Shoulders
was formed on 15.04 at 17:14:39 (UTC+0)
signal strength 2 of 5
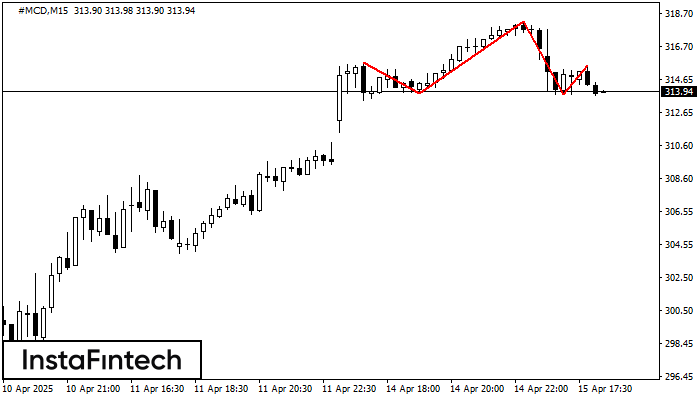
The #MCD M15 formed the Head and Shoulders pattern with the following features: The Head’s top is at 318.22, the Neckline and the upward angle are at 313.84/313.74. The formation of this pattern can bring about changes in the current trend from bullish to bearish. In case the pattern triggers the expected changes, the price of #MCD will go towards 313.52.
The M5 and M15 time frames may have more false entry points.
See Also
- All
- All
- Bearish Rectangle
- Bearish Symmetrical Triangle
- Bearish Symmetrical Triangle
- Bullish Rectangle
- Double Top
- Double Top
- Triple Bottom
- Triple Bottom
- Triple Top
- Triple Top
- All
- All
- Buy
- Sale
- All
- 1
- 2
- 3
- 4
- 5
Тройное дно
сформирован 27.05 в 22:10:53 (UTC+0)
сила сигнала 1 из 5
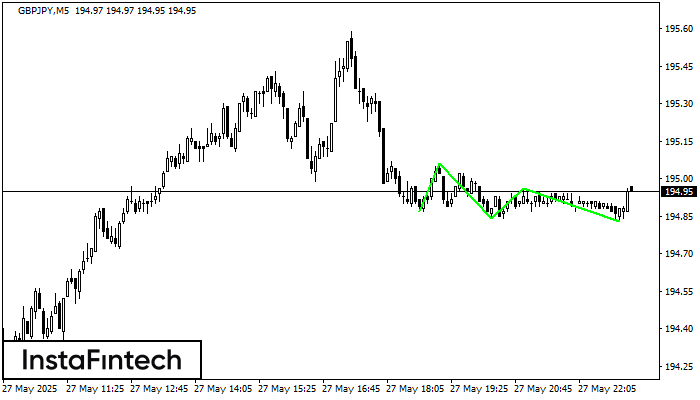
Сформирована фигура «Тройное дно» по торговому инструменту GBPJPY на M5. Фигура сигнализирует об изменении тенденции с нисходящей на восходящую в случае пробоя верхней границы 194.96
Таймфреймы М5 и М15 могут иметь больше ложных точек входа.
Открыть график инструмента в новом окне
Прямоугольник
сформирован 27.05 в 21:58:31 (UTC+0)
сила сигнала 2 из 5
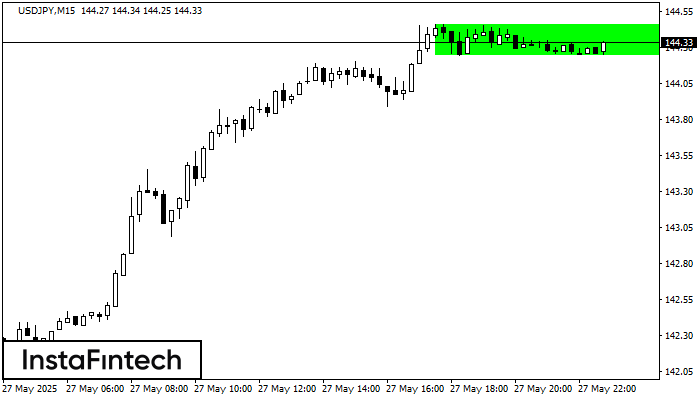
Сформирована фигура «Прямоугольник» на графике USDJPY M15. Тип фигуры: Продолжение тренда; Границы: Верхняя 144.46, Нижняя 144.24; Сигнал: позицию на покупку следует открывать выше верхней границы прямоугольника 144.46
Таймфреймы М5 и М15 могут иметь больше ложных точек входа.
Открыть график инструмента в новом окне
Двойная вершина
сформирован 27.05 в 21:55:25 (UTC+0)
сила сигнала 1 из 5
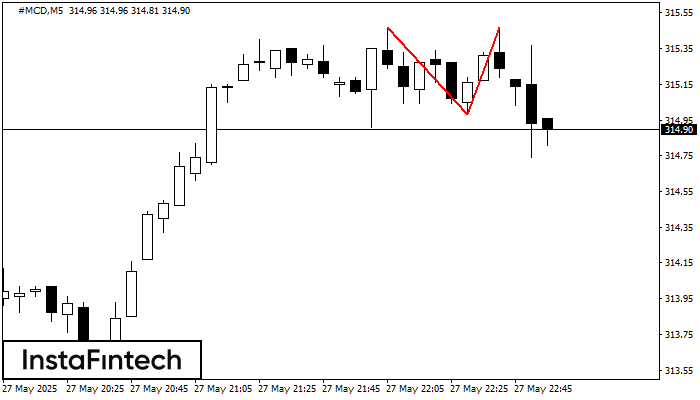
По #MCD на M5 сформировалась разворотная фигура «Двойная вершина». Характеристика: Верхняя граница 315.47; Нижняя граница 314.98; Ширина фигуры 49 пунктов. Позицию на продажу возможно открыть ниже нижней границы 314.98
Таймфреймы М5 и М15 могут иметь больше ложных точек входа.
Открыть график инструмента в новом окне


