

वास्तविक पैटर्न

पैटर्न ग्राफिकल मॉडल हैं जो चार्ट में मूल्य से बने होते हैं। तकनीकी विश्लेषण भविष्यवाणियों में से एक के अनुसार, इतिहास का मतलब मूल्य आंदोलन खुद को दोहराता है। इसका मतलब है कि मूल्य आंदोलन अक्सर एक ही परिस्थितियों में समान होते हैं जो उच्च संभावना के साथ स्थिति के आगे के विकास की भविष्यवाणी करना संभव बनाता है।
इंस्टा फॉरेक्स द्वारा प्रासंगिक पैटर्न एक उपयोग में आसान सेवा है जो आपको बाजार में नवीनतम परिवर्तनों के बारे में जागरूक होने और समय पर बाजार से संकेतों पर प्रतिक्रिया करने की अनुमति देती है। हमारी सेवा में आप हमेशा किसी भी जोड़ी और किसी भी समय सीमा पर नवीनतम और सबसे प्रासंगिक पैटर्न प्राप्त कर सकते हैं.
Triple Top
was formed on 15.04 at 16:30:04 (UTC+0)
signal strength 3 of 5
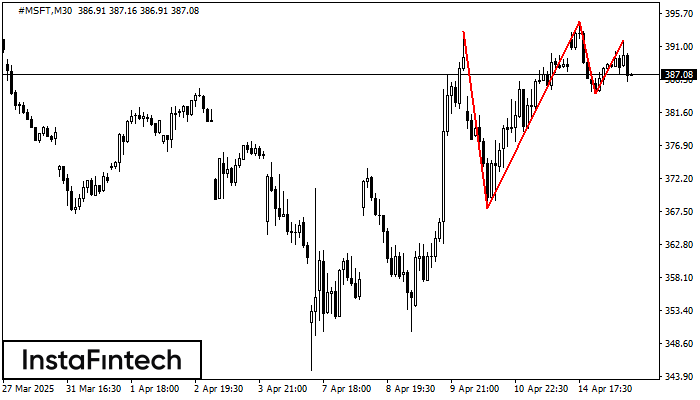
On the chart of the #MSFT M30 trading instrument, the Triple Top pattern that signals a trend change has formed. It is possible that after formation of the third peak, the price will try to break through the resistance level 367.97, where we advise to open a trading position for sale. Take profit is the projection of the pattern’s width, which is 2524 points.
- All
- All
- Bearish Rectangle
- Bearish Symmetrical Triangle
- Bearish Symmetrical Triangle
- Bullish Rectangle
- Double Top
- Double Top
- Triple Bottom
- Triple Bottom
- Triple Top
- Triple Top
- All
- All
- Buy
- Sale
- All
- 1
- 2
- 3
- 4
- 5
Bullish Symmetrical Triangle
was formed on 28.05 at 17:35:33 (UTC+0)
signal strength 1 of 5
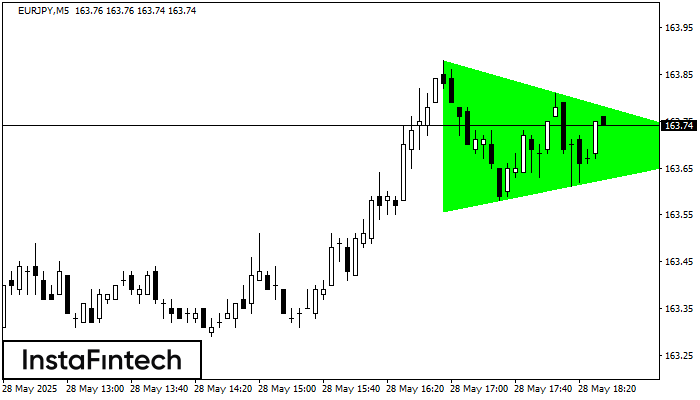
According to the chart of M5, EURJPY formed the Bullish Symmetrical Triangle pattern. Description: This is the pattern of a trend continuation. 163.88 and 163.56 are the coordinates
The M5 and M15 time frames may have more false entry points.
Open chart in a new window
Double Bottom
was formed on 28.05 at 17:35:28 (UTC+0)
signal strength 1 of 5
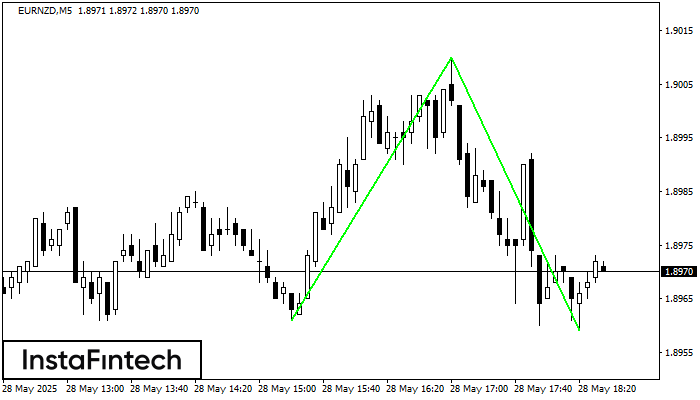
The Double Bottom pattern has been formed on EURNZD M5; the upper boundary is 1.9010; the lower boundary is 1.8959. The width of the pattern is 49 points. In case
The M5 and M15 time frames may have more false entry points.
Open chart in a new window
Double Bottom
was formed on 28.05 at 17:20:09 (UTC+0)
signal strength 1 of 5
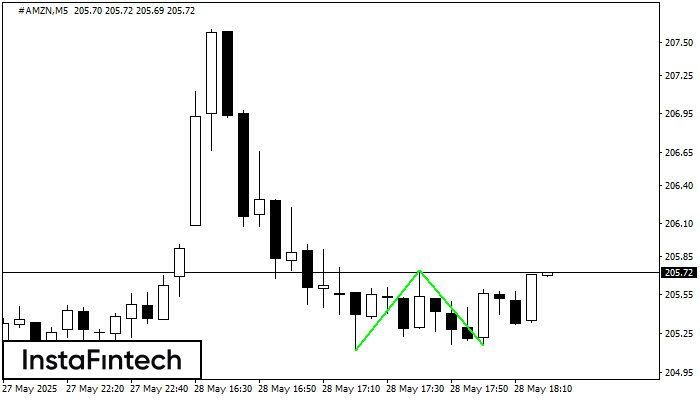
The Double Bottom pattern has been formed on #AMZN M5; the upper boundary is 205.74; the lower boundary is 205.16. The width of the pattern is 62 points. In case
The M5 and M15 time frames may have more false entry points.
Open chart in a new window


