

वास्तविक पैटर्न

पैटर्न ग्राफिकल मॉडल हैं जो चार्ट में मूल्य से बने होते हैं। तकनीकी विश्लेषण भविष्यवाणियों में से एक के अनुसार, इतिहास का मतलब मूल्य आंदोलन खुद को दोहराता है। इसका मतलब है कि मूल्य आंदोलन अक्सर एक ही परिस्थितियों में समान होते हैं जो उच्च संभावना के साथ स्थिति के आगे के विकास की भविष्यवाणी करना संभव बनाता है।
इंस्टा फॉरेक्स द्वारा प्रासंगिक पैटर्न एक उपयोग में आसान सेवा है जो आपको बाजार में नवीनतम परिवर्तनों के बारे में जागरूक होने और समय पर बाजार से संकेतों पर प्रतिक्रिया करने की अनुमति देती है। हमारी सेवा में आप हमेशा किसी भी जोड़ी और किसी भी समय सीमा पर नवीनतम और सबसे प्रासंगिक पैटर्न प्राप्त कर सकते हैं.
Double Top
was formed on 15.04 at 15:59:44 (UTC+0)
signal strength 3 of 5
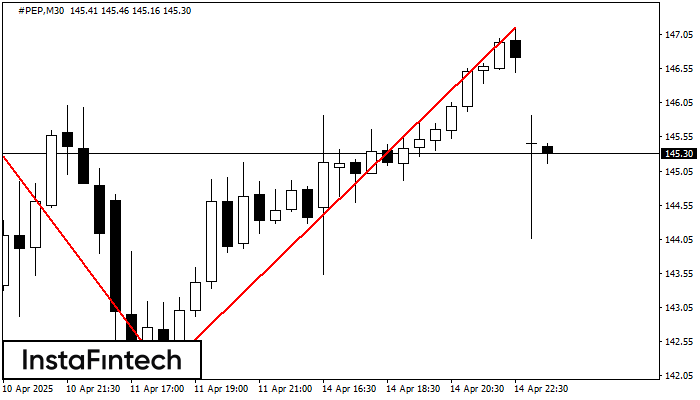
The Double Top pattern has been formed on #PEP M30. It signals that the trend has been changed from upwards to downwards. Probably, if the base of the pattern 142.13 is broken, the downward movement will continue.
See Also
- All
- All
- Bearish Rectangle
- Bearish Symmetrical Triangle
- Bearish Symmetrical Triangle
- Bullish Rectangle
- Double Top
- Double Top
- Triple Bottom
- Triple Bottom
- Triple Top
- Triple Top
- All
- All
- Buy
- Sale
- All
- 1
- 2
- 3
- 4
- 5
बुलिश सिमेट्रिकल त्रिभुज
was formed on 24.05 at 18:46:25 (UTC+0)
signal strength 2 of 5

M15 के चार्ट के अनुसार, #Bitcoin से बुलिश सिमेट्रिकल त्रिभुज पैटर्न बना, जो दर्शाता है कि ट्रेंड जारी रहेगा। विवरण: पैटर्न की ऊपरी सीमा निर्देशांक 109440.14/108872.57 को स्पर्श करती है
M5 और M15 समय सीमा में अधिक फाल्स एंट्री पॉइंट्स हो सकते हैं।
Open chart in a new window
बियरिश आयत
was formed on 23.05 at 23:00:20 (UTC+0)
signal strength 1 of 5

M5 के चार्ट के अनुसार, EURNZD से बियरिश आयत बना। पैटर्न प्रवृत्ति निरंतरता को इंगित करता है। ऊपरी सीमा 1.8982 है, निचली सीमा 1.8964 है। सिग्नल का मतलब है कि
M5 और M15 समय सीमा में अधिक फाल्स एंट्री पॉइंट्स हो सकते हैं।
Open chart in a new window
बुलिश सिमेट्रिकल त्रिभुज
was formed on 23.05 at 22:14:53 (UTC+0)
signal strength 1 of 5

M5 के चार्ट के अनुसार, AUDCHF से बुलिश सिमेट्रिकल त्रिभुज पैटर्न बना। विवरण: यह एक ट्रेंड जारी रहने का पैटर्न है। 0.5335 और 0.5329 क्रमशः ऊपरी और निचली सीमाओं के
M5 और M15 समय सीमा में अधिक फाल्स एंट्री पॉइंट्स हो सकते हैं।
Open chart in a new window


