

वास्तविक पैटर्न

पैटर्न ग्राफिकल मॉडल हैं जो चार्ट में मूल्य से बने होते हैं। तकनीकी विश्लेषण भविष्यवाणियों में से एक के अनुसार, इतिहास का मतलब मूल्य आंदोलन खुद को दोहराता है। इसका मतलब है कि मूल्य आंदोलन अक्सर एक ही परिस्थितियों में समान होते हैं जो उच्च संभावना के साथ स्थिति के आगे के विकास की भविष्यवाणी करना संभव बनाता है।
इंस्टा फॉरेक्स द्वारा प्रासंगिक पैटर्न एक उपयोग में आसान सेवा है जो आपको बाजार में नवीनतम परिवर्तनों के बारे में जागरूक होने और समय पर बाजार से संकेतों पर प्रतिक्रिया करने की अनुमति देती है। हमारी सेवा में आप हमेशा किसी भी जोड़ी और किसी भी समय सीमा पर नवीनतम और सबसे प्रासंगिक पैटर्न प्राप्त कर सकते हैं.
Bullish pennant
was formed on 14.04 at 20:17:04 (UTC+0)
signal strength 1 of 5
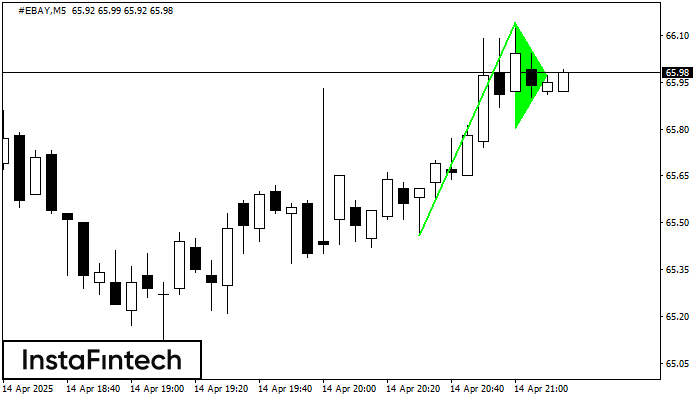
The Bullish pennant pattern is formed on the #EBAY M5 chart. It is a type of the continuation pattern. Supposedly, in case the price is fixed above the pennant’s high of 66.14, a further uptrend is possible.
The M5 and M15 time frames may have more false entry points.
See Also
- All
- All
- Bearish Rectangle
- Bearish Symmetrical Triangle
- Bearish Symmetrical Triangle
- Bullish Rectangle
- Double Top
- Double Top
- Triple Bottom
- Triple Bottom
- Triple Top
- Triple Top
- All
- All
- Buy
- Sale
- All
- 1
- 2
- 3
- 4
- 5
Double Top
was formed on 26.05 at 05:05:43 (UTC+0)
signal strength 1 of 5
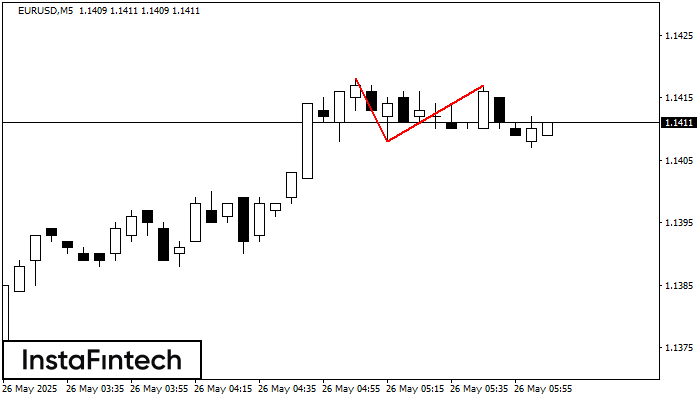
On the chart of EURUSD M5 the Double Top reversal pattern has been formed. Characteristics: the upper boundary 1.1417; the lower boundary 1.1408; the width of the pattern 9 points
The M5 and M15 time frames may have more false entry points.
Open chart in a new window
Double Top
was formed on 26.05 at 05:05:40 (UTC+0)
signal strength 1 of 5
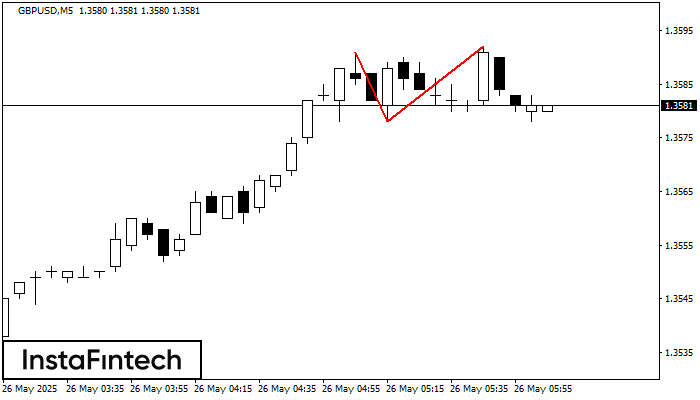
On the chart of GBPUSD M5 the Double Top reversal pattern has been formed. Characteristics: the upper boundary 1.3592; the lower boundary 1.3578; the width of the pattern 14 points
The M5 and M15 time frames may have more false entry points.
Open chart in a new window
Double Top
was formed on 26.05 at 04:15:25 (UTC+0)
signal strength 2 of 5
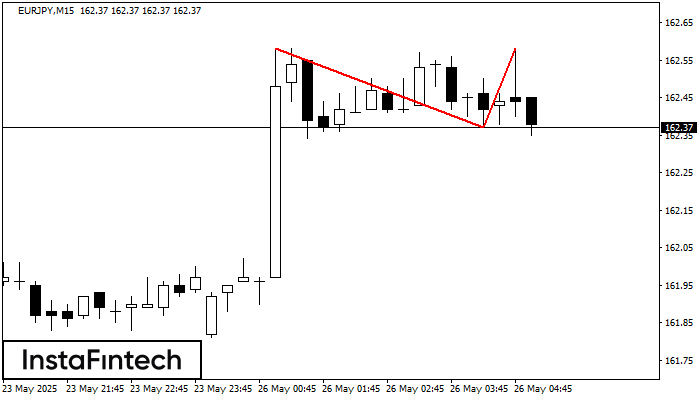
On the chart of EURJPY M15 the Double Top reversal pattern has been formed. Characteristics: the upper boundary 162.58; the lower boundary 162.37; the width of the pattern 21 points
The M5 and M15 time frames may have more false entry points.
Open chart in a new window


