

वास्तविक पैटर्न

पैटर्न ग्राफिकल मॉडल हैं जो चार्ट में मूल्य से बने होते हैं। तकनीकी विश्लेषण भविष्यवाणियों में से एक के अनुसार, इतिहास का मतलब मूल्य आंदोलन खुद को दोहराता है। इसका मतलब है कि मूल्य आंदोलन अक्सर एक ही परिस्थितियों में समान होते हैं जो उच्च संभावना के साथ स्थिति के आगे के विकास की भविष्यवाणी करना संभव बनाता है।
इंस्टा फॉरेक्स द्वारा प्रासंगिक पैटर्न एक उपयोग में आसान सेवा है जो आपको बाजार में नवीनतम परिवर्तनों के बारे में जागरूक होने और समय पर बाजार से संकेतों पर प्रतिक्रिया करने की अनुमति देती है। हमारी सेवा में आप हमेशा किसी भी जोड़ी और किसी भी समय सीमा पर नवीनतम और सबसे प्रासंगिक पैटर्न प्राप्त कर सकते हैं.
Double Bottom
was formed on 14.04 at 20:00:18 (UTC+0)
signal strength 2 of 5
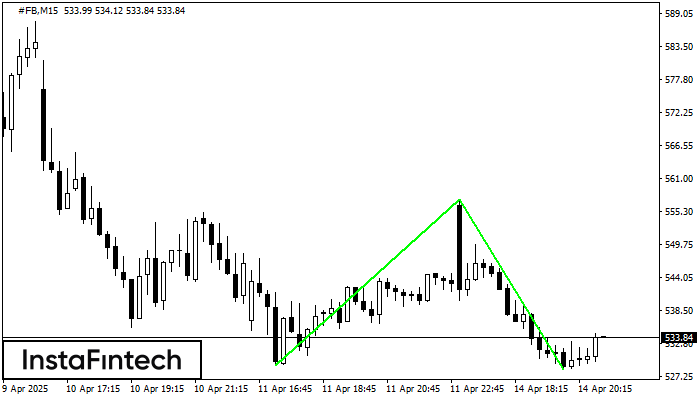
The Double Bottom pattern has been formed on #FB M15. Characteristics: the support level 529.17; the resistance level 557.42; the width of the pattern 2825 points. If the resistance level is broken, a change in the trend can be predicted with the first target point lying at the distance of 2905 points.
The M5 and M15 time frames may have more false entry points.
- All
- All
- Bearish Rectangle
- Bearish Symmetrical Triangle
- Bearish Symmetrical Triangle
- Bullish Rectangle
- Double Top
- Double Top
- Triple Bottom
- Triple Bottom
- Triple Top
- Triple Top
- All
- All
- Buy
- Sale
- All
- 1
- 2
- 3
- 4
- 5
Bearish Rectangle
сформирован 23.05 в 23:00:20 (UTC+0)
сила сигнала 1 из 5

According to the chart of M5, EURNZD formed the Bearish Rectangle. The pattern indicates a trend continuation. The upper border is 1.8982, the lower border is 1.8964. The signal means
The M5 and M15 time frames may have more false entry points.
Открыть график инструмента в новом окне
Bullish Symmetrical Triangle
сформирован 23.05 в 22:14:53 (UTC+0)
сила сигнала 1 из 5

According to the chart of M5, AUDCHF formed the Bullish Symmetrical Triangle pattern. Description: This is the pattern of a trend continuation. 0.5335 and 0.5329 are the coordinates
The M5 and M15 time frames may have more false entry points.
Открыть график инструмента в новом окне
Bullish Symmetrical Triangle
сформирован 23.05 в 22:10:58 (UTC+0)
сила сигнала 1 из 5

According to the chart of M5, AUDJPY formed the Bullish Symmetrical Triangle pattern. Description: This is the pattern of a trend continuation. 92.60 and 92.44 are the coordinates
The M5 and M15 time frames may have more false entry points.
Открыть график инструмента в новом окне


