

वास्तविक पैटर्न

पैटर्न ग्राफिकल मॉडल हैं जो चार्ट में मूल्य से बने होते हैं। तकनीकी विश्लेषण भविष्यवाणियों में से एक के अनुसार, इतिहास का मतलब मूल्य आंदोलन खुद को दोहराता है। इसका मतलब है कि मूल्य आंदोलन अक्सर एक ही परिस्थितियों में समान होते हैं जो उच्च संभावना के साथ स्थिति के आगे के विकास की भविष्यवाणी करना संभव बनाता है।
इंस्टा फॉरेक्स द्वारा प्रासंगिक पैटर्न एक उपयोग में आसान सेवा है जो आपको बाजार में नवीनतम परिवर्तनों के बारे में जागरूक होने और समय पर बाजार से संकेतों पर प्रतिक्रिया करने की अनुमति देती है। हमारी सेवा में आप हमेशा किसी भी जोड़ी और किसी भी समय सीमा पर नवीनतम और सबसे प्रासंगिक पैटर्न प्राप्त कर सकते हैं.
Bullish pennant
was formed on 14.04 at 16:00:24 (UTC+0)
signal strength 1 of 5
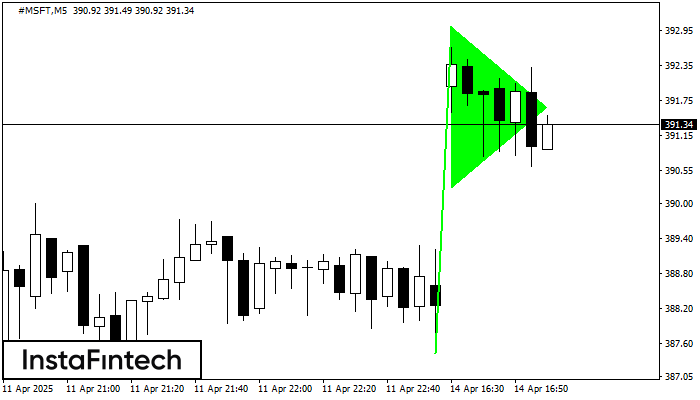
The Bullish pennant pattern is formed on the #MSFT M5 chart. It is a type of the continuation pattern. Supposedly, in case the price is fixed above the pennant’s high of 393.01, a further uptrend is possible.
The M5 and M15 time frames may have more false entry points.
- All
- All
- Bearish Rectangle
- Bearish Symmetrical Triangle
- Bearish Symmetrical Triangle
- Bullish Rectangle
- Double Top
- Double Top
- Triple Bottom
- Triple Bottom
- Triple Top
- Triple Top
- All
- All
- Buy
- Sale
- All
- 1
- 2
- 3
- 4
- 5
Double Bottom
was formed on 27.05 at 23:30:20 (UTC+0)
signal strength 1 of 5
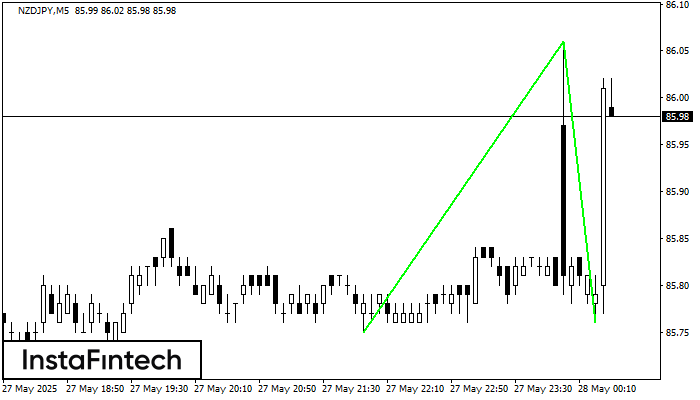
Corak Double Bottom telah dibentuk pada NZDJPY M5. Pembentukan ini menandakan pembalikan aliran dari aliran menurun ke atas. Isyarat ialah perdagangan membeli harus dibuka selepas sempadan atas corak 86.06 telah
Carta masa M5 dan M15 mungkin mempunyai lebih banyak titik kemasukan palsu.
Open chart in a new window
Double Bottom
was formed on 27.05 at 23:30:11 (UTC+0)
signal strength 3 of 5
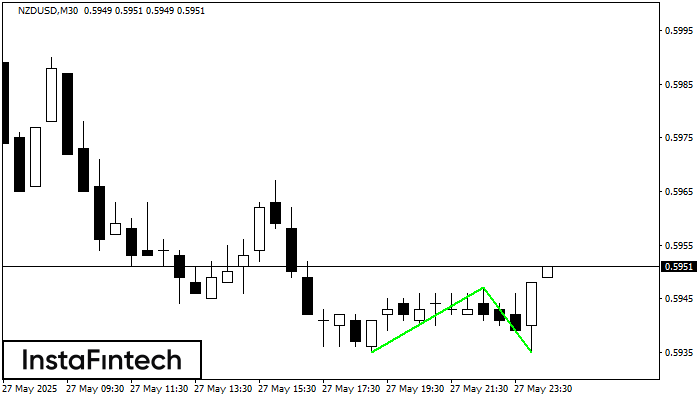
Corak Double Bottom telah dibentuk pada NZDUSD M30; sempadan atas adalah 0.5947; sempadan bawah adalah 0.5935. Lebar corak adalah 12 mata. Sekiranya penembusan sempadan atas 0.5947, perubahan aliran boleh diramalkan
Open chart in a new window
Triple Top
was formed on 27.05 at 23:15:37 (UTC+0)
signal strength 2 of 5
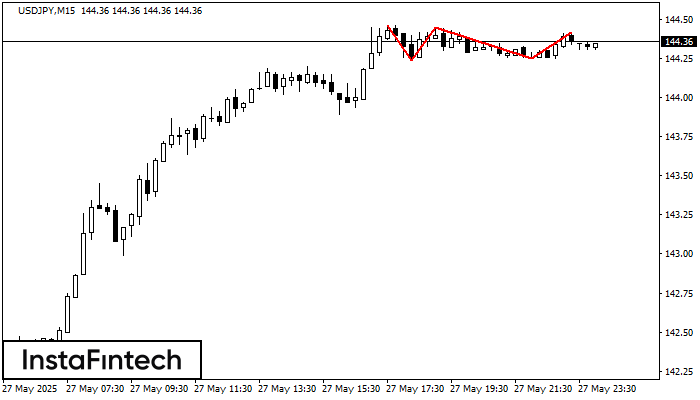
Corak Triple Top telah dibentuk pada carta bagi instrumen dagangan USDJPY M15. Ia adalah corak pembalikan yang memaparkan ciri-ciri berikut: tahap rintangan 4, tahap sokongan -1, dan lebar corak
Carta masa M5 dan M15 mungkin mempunyai lebih banyak titik kemasukan palsu.
Open chart in a new window
