

वास्तविक पैटर्न

पैटर्न ग्राफिकल मॉडल हैं जो चार्ट में मूल्य से बने होते हैं। तकनीकी विश्लेषण भविष्यवाणियों में से एक के अनुसार, इतिहास का मतलब मूल्य आंदोलन खुद को दोहराता है। इसका मतलब है कि मूल्य आंदोलन अक्सर एक ही परिस्थितियों में समान होते हैं जो उच्च संभावना के साथ स्थिति के आगे के विकास की भविष्यवाणी करना संभव बनाता है।
इंस्टा फॉरेक्स द्वारा प्रासंगिक पैटर्न एक उपयोग में आसान सेवा है जो आपको बाजार में नवीनतम परिवर्तनों के बारे में जागरूक होने और समय पर बाजार से संकेतों पर प्रतिक्रिया करने की अनुमति देती है। हमारी सेवा में आप हमेशा किसी भी जोड़ी और किसी भी समय सीमा पर नवीनतम और सबसे प्रासंगिक पैटर्न प्राप्त कर सकते हैं.
Double Bottom
was formed on 14.04 at 09:10:12 (UTC+0)
signal strength 1 of 5
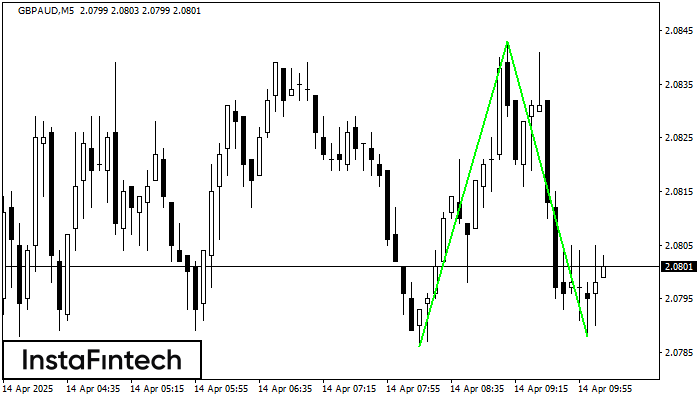
The Double Bottom pattern has been formed on GBPAUD M5. Characteristics: the support level 2.0786; the resistance level 2.0843; the width of the pattern 57 points. If the resistance level is broken, a change in the trend can be predicted with the first target point lying at the distance of 55 points.
The M5 and M15 time frames may have more false entry points.
See Also
- All
- All
- Bearish Rectangle
- Bearish Symmetrical Triangle
- Bearish Symmetrical Triangle
- Bullish Rectangle
- Double Top
- Double Top
- Triple Bottom
- Triple Bottom
- Triple Top
- Triple Top
- All
- All
- Buy
- Sale
- All
- 1
- 2
- 3
- 4
- 5
Двойное дно
сформирован 05.08 в 10:00:07 (UTC+0)
сила сигнала 4 из 5
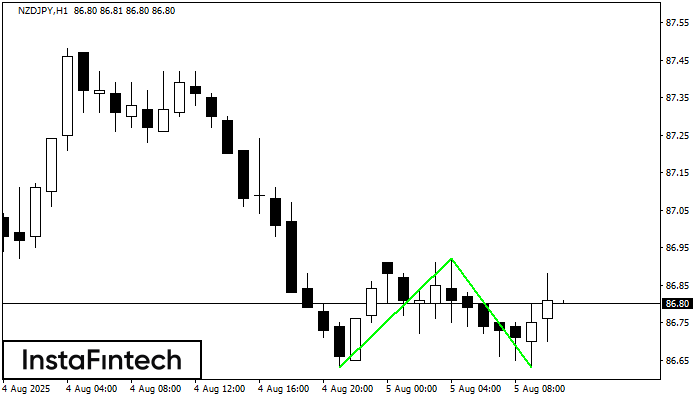
Сформирована фигура «Двойное дно» на графике NZDJPY H1. Данное формирование сигнализирует об изменении тенденции с нисходящего на восходящее движение. Сигнал: Торговую позицию на покупку следует открывать после пробоя верхней границы
Открыть график инструмента в новом окне
Тройное дно
сформирован 05.08 в 10:00:06 (UTC+0)
сила сигнала 4 из 5
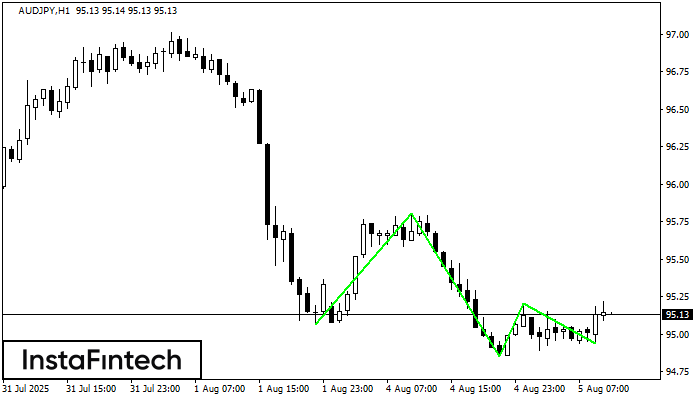
По торговому инструменту AUDJPY на H1 была сформирована графическая фигура «Тройное дно» с характеристиками: Уровень сопротивления 95.20; Уровень поддержки 94.94; Ширина 26 пунктов. В случае пробоя уровня сопротивления 95.80 котировка
Открыть график инструмента в новом окне
Двойное дно
сформирован 05.08 в 09:30:12 (UTC+0)
сила сигнала 3 из 5
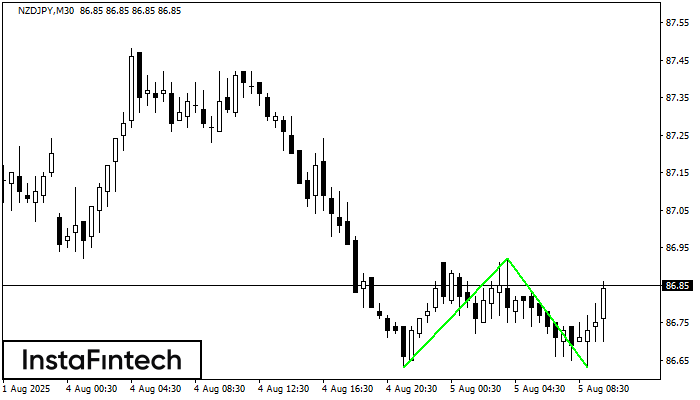
Сформирована фигура «Двойное дно» на графике NZDJPY M30. Характеристика: Уровень поддержки 86.63; Уровень сопротивления 86.92; Ширина фигуры 29 пунктов. В случае пробоя уровня сопротивления можно будет прогнозировать изменение тенденции
Открыть график инструмента в новом окне


