

वास्तविक पैटर्न

पैटर्न ग्राफिकल मॉडल हैं जो चार्ट में मूल्य से बने होते हैं। तकनीकी विश्लेषण भविष्यवाणियों में से एक के अनुसार, इतिहास का मतलब मूल्य आंदोलन खुद को दोहराता है। इसका मतलब है कि मूल्य आंदोलन अक्सर एक ही परिस्थितियों में समान होते हैं जो उच्च संभावना के साथ स्थिति के आगे के विकास की भविष्यवाणी करना संभव बनाता है।
इंस्टा फॉरेक्स द्वारा प्रासंगिक पैटर्न एक उपयोग में आसान सेवा है जो आपको बाजार में नवीनतम परिवर्तनों के बारे में जागरूक होने और समय पर बाजार से संकेतों पर प्रतिक्रिया करने की अनुमति देती है। हमारी सेवा में आप हमेशा किसी भी जोड़ी और किसी भी समय सीमा पर नवीनतम और सबसे प्रासंगिक पैटर्न प्राप्त कर सकते हैं.
Inverse Head and Shoulder
was formed on 11.04 at 15:59:57 (UTC+0)
signal strength 3 of 5

According to the chart of M30, AUDCHF produced the pattern termed the Inverse Head and Shoulder. The Head is fixed at 0.5043 while the median line of the Neck is set at 0.5120/0.5113. The formation of the Inverse Head and Shoulder Pattern clearly indicates a reversal of the downward trend. In means that in case the scenario comes true, the price of AUDCHF will go towards 0.5143.
See Also
- All
- All
- Bearish Rectangle
- Bearish Symmetrical Triangle
- Bearish Symmetrical Triangle
- Bullish Rectangle
- Double Top
- Double Top
- Triple Bottom
- Triple Bottom
- Triple Top
- Triple Top
- All
- All
- Buy
- Sale
- All
- 1
- 2
- 3
- 4
- 5
Bawah Ganda
was formed on 08.08 at 22:31:28 (UTC+0)
signal strength 1 of 5
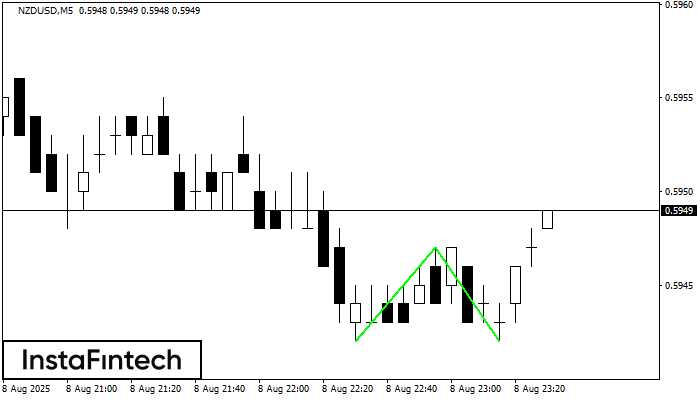
Pola Bawah Ganda telah terbentuk pada NZDUSD M5; batas atas di 0.5947; batas bawah di 0.5942. Lebar pola sebesar 5 poin. Jika harga menembus batas atas 0.5947, Perubahan dalam tren
Rangka waktu M5 dan M15 mungkin memiliki lebih dari titik entri yang keliru.
Open chart in a new window
Teratas Ganda
was formed on 08.08 at 21:30:13 (UTC+0)
signal strength 3 of 5
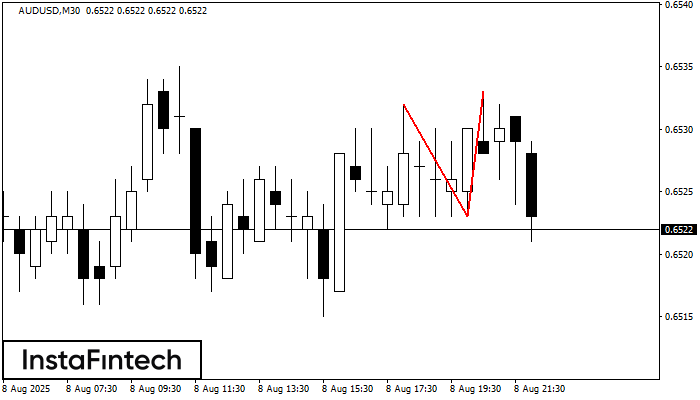
Pola Teratas Ganda telah terbentuk pada AUDUSD M30. Pola ini menandakan bahwa tren telah berubah dari kenaikan menjadi penurunan. Mungkin, jika dasar pola di 0.6523 ditembus, maka pergerakan menurun akan
Open chart in a new window
Panji Bullish
was formed on 08.08 at 21:12:19 (UTC+0)
signal strength 3 of 5
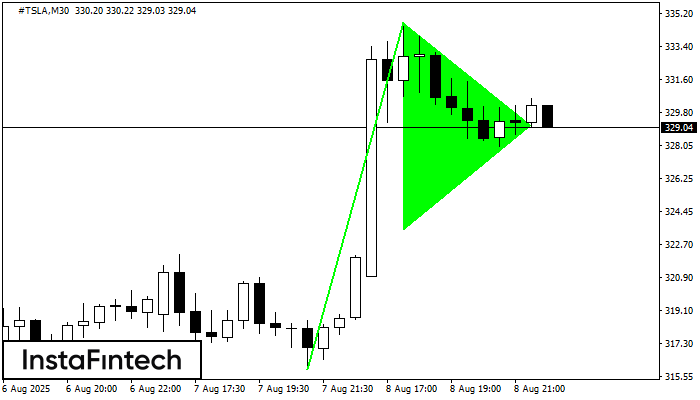
Pola Panji Bullish terbentuk di grafik #TSLA M30. Ini adalah jenis pola kelanjutan. Diduga, jika harga ditetapkan di atas titik tertinggi panji di 334.72, tren naik selanjutnya mungkin terjadi
Open chart in a new window


