

वास्तविक पैटर्न

पैटर्न ग्राफिकल मॉडल हैं जो चार्ट में मूल्य से बने होते हैं। तकनीकी विश्लेषण भविष्यवाणियों में से एक के अनुसार, इतिहास का मतलब मूल्य आंदोलन खुद को दोहराता है। इसका मतलब है कि मूल्य आंदोलन अक्सर एक ही परिस्थितियों में समान होते हैं जो उच्च संभावना के साथ स्थिति के आगे के विकास की भविष्यवाणी करना संभव बनाता है।
इंस्टा फॉरेक्स द्वारा प्रासंगिक पैटर्न एक उपयोग में आसान सेवा है जो आपको बाजार में नवीनतम परिवर्तनों के बारे में जागरूक होने और समय पर बाजार से संकेतों पर प्रतिक्रिया करने की अनुमति देती है। हमारी सेवा में आप हमेशा किसी भी जोड़ी और किसी भी समय सीमा पर नवीनतम और सबसे प्रासंगिक पैटर्न प्राप्त कर सकते हैं.
Bullish Symmetrical Triangle
was formed on 10.04 at 22:36:35 (UTC+0)
signal strength 1 of 5
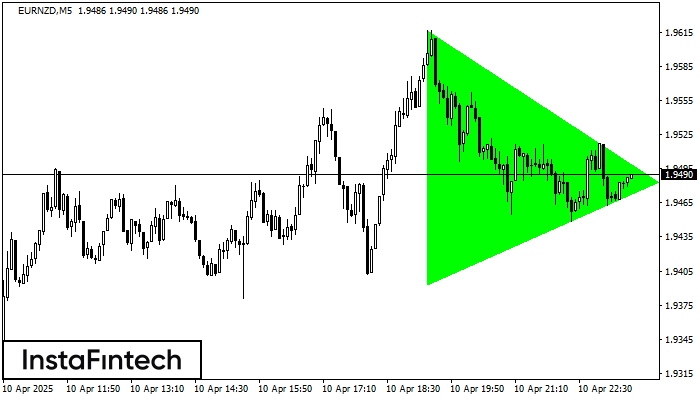
According to the chart of M5, EURNZD formed the Bullish Symmetrical Triangle pattern, which signals the trend will continue. Description. The upper border of the pattern touches the coordinates 1.9617/1.9483 whereas the lower border goes across 1.9393/1.9483. The pattern width is measured on the chart at 224 pips. If the Bullish Symmetrical Triangle pattern is in progress during the upward trend, this indicates the current trend will go on. In case 1.9483 is broken, the price could continue its move toward 1.9498.
The M5 and M15 time frames may have more false entry points.
- All
- All
- Bearish Rectangle
- Bearish Symmetrical Triangle
- Bearish Symmetrical Triangle
- Bullish Rectangle
- Double Top
- Double Top
- Triple Bottom
- Triple Bottom
- Triple Top
- Triple Top
- All
- All
- Buy
- Sale
- All
- 1
- 2
- 3
- 4
- 5
Triple Bottom
was formed on 25.05 at 15:59:45 (UTC+0)
signal strength 4 of 5

The Triple Bottom pattern has formed on the chart of the #Bitcoin H1 trading instrument. The pattern signals a change in the trend from downwards to upwards in the case
Open chart in a new window
Double Bottom
was formed on 25.05 at 12:20:13 (UTC+0)
signal strength 1 of 5

The Double Bottom pattern has been formed on #Bitcoin M5. Characteristics: the support level 106888.42; the resistance level 107214.56; the width of the pattern 32614 points. If the resistance level
The M5 and M15 time frames may have more false entry points.
Open chart in a new window
Bullish Rectangle
was formed on 25.05 at 07:55:30 (UTC+0)
signal strength 1 of 5

According to the chart of M5, #Bitcoin formed the Bullish Rectangle which is a pattern of a trend continuation. The pattern is contained within the following borders: the lower border
The M5 and M15 time frames may have more false entry points.
Open chart in a new window


