

वास्तविक पैटर्न

पैटर्न ग्राफिकल मॉडल हैं जो चार्ट में मूल्य से बने होते हैं। तकनीकी विश्लेषण भविष्यवाणियों में से एक के अनुसार, इतिहास का मतलब मूल्य आंदोलन खुद को दोहराता है। इसका मतलब है कि मूल्य आंदोलन अक्सर एक ही परिस्थितियों में समान होते हैं जो उच्च संभावना के साथ स्थिति के आगे के विकास की भविष्यवाणी करना संभव बनाता है।
इंस्टा फॉरेक्स द्वारा प्रासंगिक पैटर्न एक उपयोग में आसान सेवा है जो आपको बाजार में नवीनतम परिवर्तनों के बारे में जागरूक होने और समय पर बाजार से संकेतों पर प्रतिक्रिया करने की अनुमति देती है। हमारी सेवा में आप हमेशा किसी भी जोड़ी और किसी भी समय सीमा पर नवीनतम और सबसे प्रासंगिक पैटर्न प्राप्त कर सकते हैं.
Bullish Rectangle
was formed on 10.04 at 13:59:36 (UTC+0)
signal strength 2 of 5
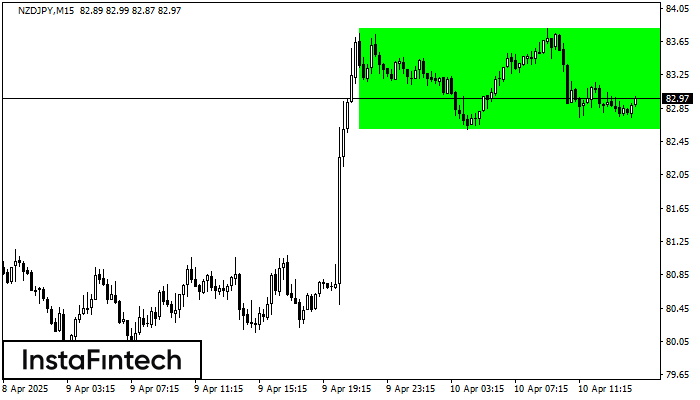
According to the chart of M15, NZDJPY formed the Bullish Rectangle. The pattern indicates a trend continuation. The upper border is 83.80, the lower border is 82.60. The signal means that a long position should be opened above the upper border 83.80 of the Bullish Rectangle.
The M5 and M15 time frames may have more false entry points.
See Also
- All
- All
- Bearish Rectangle
- Bearish Symmetrical Triangle
- Bearish Symmetrical Triangle
- Bullish Rectangle
- Double Top
- Double Top
- Triple Bottom
- Triple Bottom
- Triple Top
- Triple Top
- All
- All
- Buy
- Sale
- All
- 1
- 2
- 3
- 4
- 5
डबल बॉटम
was formed on 07.08 at 23:00:30 (UTC+0)
signal strength 5 of 5
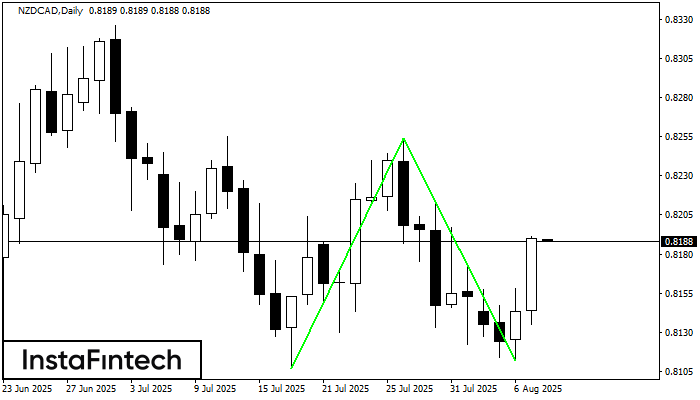
डबल बॉटम पैटर्न NZDCAD D1 पर बना है; ऊपरी सीमा 0.8254 है; निचली सीमा 0.8112 है। पैटर्न की चौड़ाई 147 अंक है। ऊपरी सीमा 0.8254 के टूटने के मामले में
Open chart in a new window
बुलिश पताका
was formed on 07.08 at 22:47:25 (UTC+0)
signal strength 2 of 5
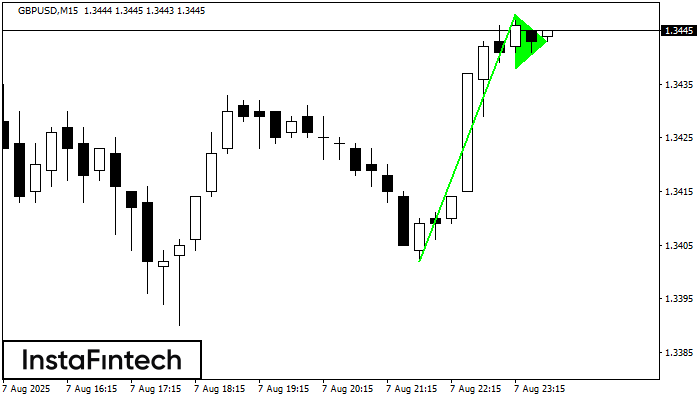
बुलिश पताका सिग्नल - ट्रेडिंग इंस्ट्रूमेंट GBPUSD M15, निरंतरता पैटर्न। पूर्वानुमान: पैटर्न के उच्च 1.3448 के ऊपर एक खरीद स्थिति सेट करना संभव है, इसके साथ अगला कदम फ्लैगपोल ऊंचाई
M5 और M15 समय सीमा में अधिक फाल्स एंट्री पॉइंट्स हो सकते हैं।
Open chart in a new window
डबल टॉप
was formed on 07.08 at 19:30:21 (UTC+0)
signal strength 1 of 5
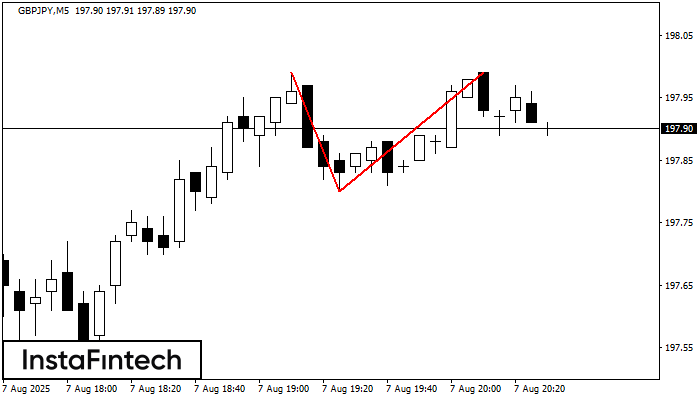
GBPJPY M5 के चार्ट पर डबल टॉप रीवर्सल पैटर्न बना है। विशेषताएं: ऊपरी सीमा 197.99; निचली सीमा 197.80; पैटर्न की चौड़ाई 19 पॉइंट्स। संकेत: निचली सीमा के टूटने से 197.65
M5 और M15 समय सीमा में अधिक फाल्स एंट्री पॉइंट्स हो सकते हैं।
Open chart in a new window


