

वास्तविक पैटर्न

पैटर्न ग्राफिकल मॉडल हैं जो चार्ट में मूल्य से बने होते हैं। तकनीकी विश्लेषण भविष्यवाणियों में से एक के अनुसार, इतिहास का मतलब मूल्य आंदोलन खुद को दोहराता है। इसका मतलब है कि मूल्य आंदोलन अक्सर एक ही परिस्थितियों में समान होते हैं जो उच्च संभावना के साथ स्थिति के आगे के विकास की भविष्यवाणी करना संभव बनाता है।
इंस्टा फॉरेक्स द्वारा प्रासंगिक पैटर्न एक उपयोग में आसान सेवा है जो आपको बाजार में नवीनतम परिवर्तनों के बारे में जागरूक होने और समय पर बाजार से संकेतों पर प्रतिक्रिया करने की अनुमति देती है। हमारी सेवा में आप हमेशा किसी भी जोड़ी और किसी भी समय सीमा पर नवीनतम और सबसे प्रासंगिक पैटर्न प्राप्त कर सकते हैं.
Double Bottom
was formed on 10.04 at 13:40:08 (UTC+0)
signal strength 1 of 5
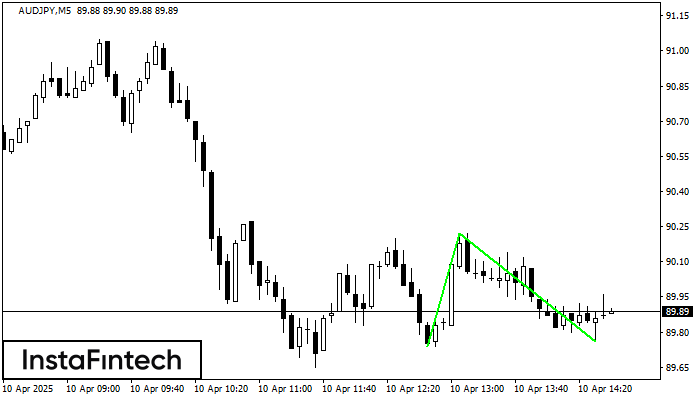
The Double Bottom pattern has been formed on AUDJPY M5; the upper boundary is 90.22; the lower boundary is 89.76. The width of the pattern is 48 points. In case of a break of the upper boundary 90.22, a change in the trend can be predicted where the width of the pattern will coincide with the distance to a possible take profit level.
The M5 and M15 time frames may have more false entry points.
- All
- All
- Bearish Rectangle
- Bearish Symmetrical Triangle
- Bearish Symmetrical Triangle
- Bullish Rectangle
- Double Top
- Double Top
- Triple Bottom
- Triple Bottom
- Triple Top
- Triple Top
- All
- All
- Buy
- Sale
- All
- 1
- 2
- 3
- 4
- 5
Bullish Rectangle
was formed on 23.05 at 06:32:41 (UTC+0)
signal strength 1 of 5
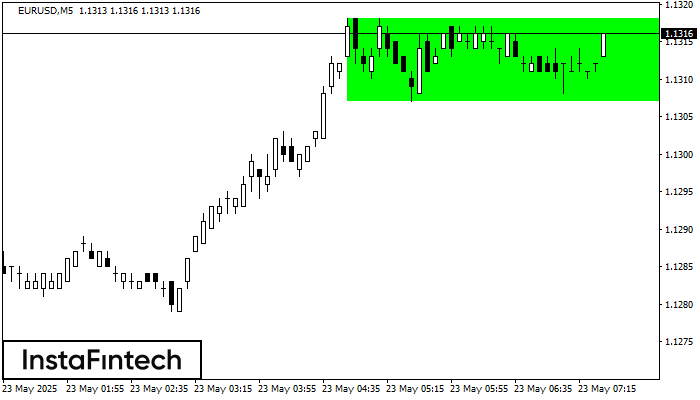
According to the chart of M5, EURUSD formed the Bullish Rectangle. This type of a pattern indicates a trend continuation. It consists of two levels: resistance 1.1318 and support 1.1307
The M5 and M15 time frames may have more false entry points.
Open chart in a new window
Double Top
was formed on 23.05 at 06:04:11 (UTC+0)
signal strength 3 of 5
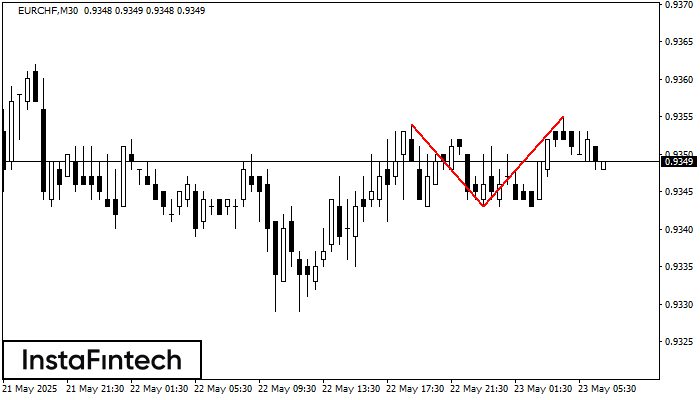
The Double Top pattern has been formed on EURCHF M30. It signals that the trend has been changed from upwards to downwards. Probably, if the base of the pattern 0.9343
Open chart in a new window
Triple Top
was formed on 23.05 at 06:00:18 (UTC+0)
signal strength 4 of 5
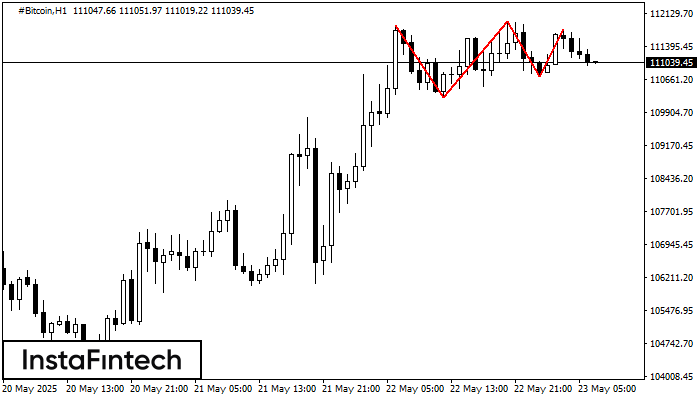
The Triple Top pattern has formed on the chart of the #Bitcoin H1. Features of the pattern: borders have an ascending angle; the lower line of the pattern
Open chart in a new window


