

वास्तविक पैटर्न

पैटर्न ग्राफिकल मॉडल हैं जो चार्ट में मूल्य से बने होते हैं। तकनीकी विश्लेषण भविष्यवाणियों में से एक के अनुसार, इतिहास का मतलब मूल्य आंदोलन खुद को दोहराता है। इसका मतलब है कि मूल्य आंदोलन अक्सर एक ही परिस्थितियों में समान होते हैं जो उच्च संभावना के साथ स्थिति के आगे के विकास की भविष्यवाणी करना संभव बनाता है।
इंस्टा फॉरेक्स द्वारा प्रासंगिक पैटर्न एक उपयोग में आसान सेवा है जो आपको बाजार में नवीनतम परिवर्तनों के बारे में जागरूक होने और समय पर बाजार से संकेतों पर प्रतिक्रिया करने की अनुमति देती है। हमारी सेवा में आप हमेशा किसी भी जोड़ी और किसी भी समय सीमा पर नवीनतम और सबसे प्रासंगिक पैटर्न प्राप्त कर सकते हैं.
Double Bottom
was formed on 10.04 at 13:30:17 (UTC+0)
signal strength 2 of 5
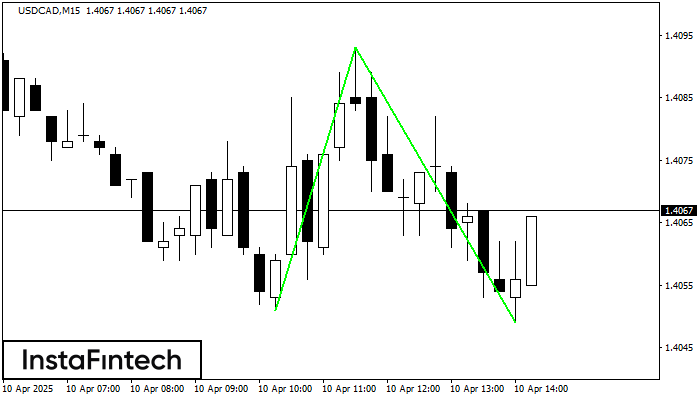
The Double Bottom pattern has been formed on USDCAD M15; the upper boundary is 1.4093; the lower boundary is 1.4049. The width of the pattern is 42 points. In case of a break of the upper boundary 1.4093, a change in the trend can be predicted where the width of the pattern will coincide with the distance to a possible take profit level.
The M5 and M15 time frames may have more false entry points.
- All
- All
- Bearish Rectangle
- Bearish Symmetrical Triangle
- Bearish Symmetrical Triangle
- Bullish Rectangle
- Double Top
- Double Top
- Triple Bottom
- Triple Bottom
- Triple Top
- Triple Top
- All
- All
- Buy
- Sale
- All
- 1
- 2
- 3
- 4
- 5
Fundo duplo
was formed on 31.05 at 13:20:01 (UTC+0)
signal strength 1 of 5

O padrão Fundo duplo foi formado em #Bitcoin M5. Características: o nível de suporte 103250.25; o nível de resistência 103385.09; a largura do padrão 13484 pontos. Se o nível
Os intervalos M5 e M15 podem ter mais pontos de entrada falsos.
Open chart in a new window
Topo triplo
was formed on 30.05 at 22:20:23 (UTC+0)
signal strength 1 of 5

O padrão Topo triplo foi formado no gráfico do instrumento de negociação GOLD M5. É um padrão de reversão com as seguintes características: nível de resistência 4, nível de suporte
Os intervalos M5 e M15 podem ter mais pontos de entrada falsos.
Open chart in a new window
Cabeça & Ombro Invertidos
was formed on 30.05 at 21:50:24 (UTC+0)
signal strength 1 of 5

De acordo com o gráfico de M5, #AMZN produziu o padrão denominado Cabeça & Ombro Invertidos. A Cabeça é definida em 201.64 enquanto a linha mediana do Pescoço é definida
Os intervalos M5 e M15 podem ter mais pontos de entrada falsos.
Open chart in a new window


