

वास्तविक पैटर्न

पैटर्न ग्राफिकल मॉडल हैं जो चार्ट में मूल्य से बने होते हैं। तकनीकी विश्लेषण भविष्यवाणियों में से एक के अनुसार, इतिहास का मतलब मूल्य आंदोलन खुद को दोहराता है। इसका मतलब है कि मूल्य आंदोलन अक्सर एक ही परिस्थितियों में समान होते हैं जो उच्च संभावना के साथ स्थिति के आगे के विकास की भविष्यवाणी करना संभव बनाता है।
इंस्टा फॉरेक्स द्वारा प्रासंगिक पैटर्न एक उपयोग में आसान सेवा है जो आपको बाजार में नवीनतम परिवर्तनों के बारे में जागरूक होने और समय पर बाजार से संकेतों पर प्रतिक्रिया करने की अनुमति देती है। हमारी सेवा में आप हमेशा किसी भी जोड़ी और किसी भी समय सीमा पर नवीनतम और सबसे प्रासंगिक पैटर्न प्राप्त कर सकते हैं.
Double Bottom
was formed on 09.04 at 12:59:46 (UTC+0)
signal strength 2 of 5
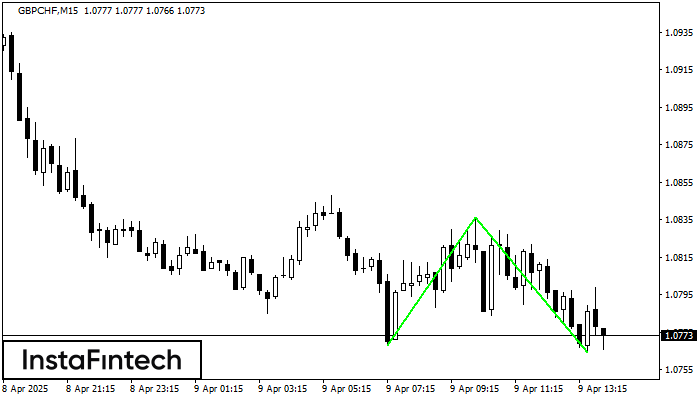
The Double Bottom pattern has been formed on GBPCHF M15; the upper boundary is 1.0836; the lower boundary is 1.0764. The width of the pattern is 68 points. In case of a break of the upper boundary 1.0836, a change in the trend can be predicted where the width of the pattern will coincide with the distance to a possible take profit level.
The M5 and M15 time frames may have more false entry points.
- All
- All
- Bearish Rectangle
- Bearish Symmetrical Triangle
- Bearish Symmetrical Triangle
- Bullish Rectangle
- Double Top
- Double Top
- Triple Bottom
- Triple Bottom
- Triple Top
- Triple Top
- All
- All
- Buy
- Sale
- All
- 1
- 2
- 3
- 4
- 5
Bearish Rectangle
was formed on 22.05 at 04:18:29 (UTC+0)
signal strength 1 of 5
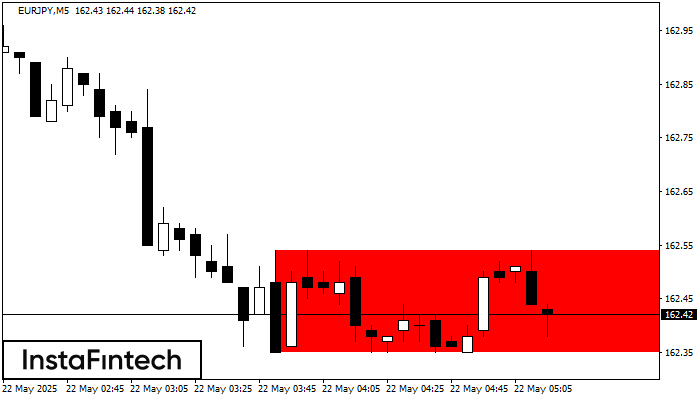
According to the chart of M5, EURJPY formed the Bearish Rectangle. This type of a pattern indicates a trend continuation. It consists of two levels: resistance 162.54 - 0.00
The M5 and M15 time frames may have more false entry points.
Open chart in a new window
Double Top
was formed on 22.05 at 04:15:29 (UTC+0)
signal strength 1 of 5
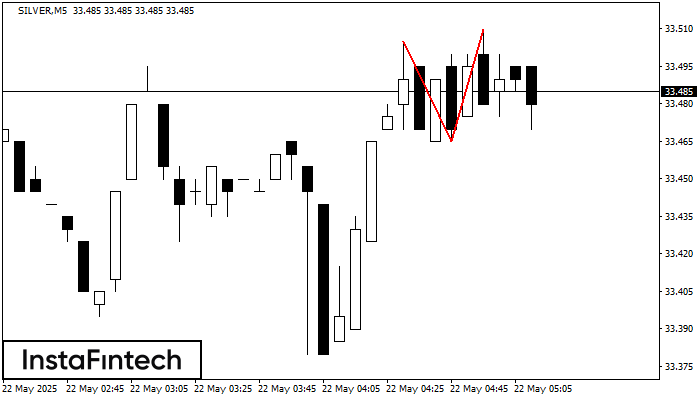
The Double Top reversal pattern has been formed on SILVER M5. Characteristics: the upper boundary 33.51; the lower boundary 33.47; the width of the pattern is 45 points. Sell trades
The M5 and M15 time frames may have more false entry points.
Open chart in a new window
Bullish Symmetrical Triangle
was formed on 22.05 at 03:55:35 (UTC+0)
signal strength 1 of 5
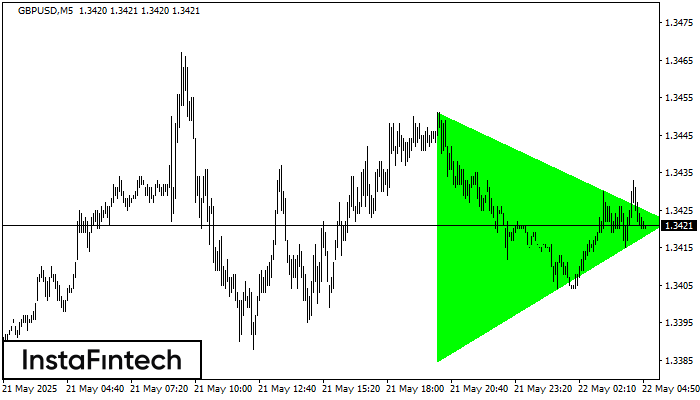
According to the chart of M5, GBPUSD formed the Bullish Symmetrical Triangle pattern. Description: This is the pattern of a trend continuation. 1.3451 and 1.3385 are the coordinates
The M5 and M15 time frames may have more false entry points.
Open chart in a new window


