

वास्तविक पैटर्न

पैटर्न ग्राफिकल मॉडल हैं जो चार्ट में मूल्य से बने होते हैं। तकनीकी विश्लेषण भविष्यवाणियों में से एक के अनुसार, इतिहास का मतलब मूल्य आंदोलन खुद को दोहराता है। इसका मतलब है कि मूल्य आंदोलन अक्सर एक ही परिस्थितियों में समान होते हैं जो उच्च संभावना के साथ स्थिति के आगे के विकास की भविष्यवाणी करना संभव बनाता है।
इंस्टा फॉरेक्स द्वारा प्रासंगिक पैटर्न एक उपयोग में आसान सेवा है जो आपको बाजार में नवीनतम परिवर्तनों के बारे में जागरूक होने और समय पर बाजार से संकेतों पर प्रतिक्रिया करने की अनुमति देती है। हमारी सेवा में आप हमेशा किसी भी जोड़ी और किसी भी समय सीमा पर नवीनतम और सबसे प्रासंगिक पैटर्न प्राप्त कर सकते हैं.
Double Top
was formed on 09.04 at 10:34:51 (UTC+0)
signal strength 1 of 5
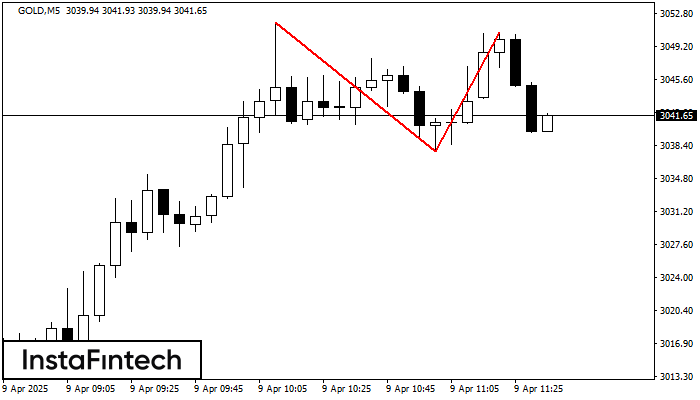
On the chart of GOLD M5 the Double Top reversal pattern has been formed. Characteristics: the upper boundary 3050.69; the lower boundary 3037.74; the width of the pattern 1295 points. The signal: a break of the lower boundary will cause continuation of the downward trend targeting the 3037.59 level.
The M5 and M15 time frames may have more false entry points.
See Also
- All
- All
- Bearish Rectangle
- Bearish Symmetrical Triangle
- Bearish Symmetrical Triangle
- Bullish Rectangle
- Double Top
- Double Top
- Triple Bottom
- Triple Bottom
- Triple Top
- Triple Top
- All
- All
- Buy
- Sale
- All
- 1
- 2
- 3
- 4
- 5
Прямоугольник
сформирован 25.05 в 07:55:30 (UTC+0)
сила сигнала 1 из 5

По торговому инструменту #Bitcoin на M5 сформировалась фигура продолжения тренда - «Прямоугольник». Фигура имеет границы: Нижняя 107891.05; Верхняя 108246.73. В случае пробоя верхней границы вероятно дальнейшее движение в сторону тренда
Таймфреймы М5 и М15 могут иметь больше ложных точек входа.
Открыть график инструмента в новом окне
Бычий симметричный треугольник
сформирован 24.05 в 18:46:25 (UTC+0)
сила сигнала 2 из 5

По #Bitcoin на M15 сформировалась фигура «Бычий симметричный треугольник», которая сигнализирует нам о продолжении тенденции. Характеристика: Верхняя граница фигуры имеет координаты 109440.14/108872.57; Нижняя граница 108311.13/108872.57; Проекция ширины фигуры 112901 пунктов
Таймфреймы М5 и М15 могут иметь больше ложных точек входа.
Открыть график инструмента в новом окне
Прямоугольник
сформирован 23.05 в 23:00:20 (UTC+0)
сила сигнала 1 из 5

Сформирована фигура «Прямоугольник» на графике EURNZD M5. Тип фигуры: Продолжение тренда; Границы: Верхняя 1.8982, Нижняя 1.8964; Сигнал: позиция на продажу открывается после фиксации цены ниже границы прямоугольника 1.8964
Таймфреймы М5 и М15 могут иметь больше ложных точек входа.
Открыть график инструмента в новом окне


