

वास्तविक पैटर्न

पैटर्न ग्राफिकल मॉडल हैं जो चार्ट में मूल्य से बने होते हैं। तकनीकी विश्लेषण भविष्यवाणियों में से एक के अनुसार, इतिहास का मतलब मूल्य आंदोलन खुद को दोहराता है। इसका मतलब है कि मूल्य आंदोलन अक्सर एक ही परिस्थितियों में समान होते हैं जो उच्च संभावना के साथ स्थिति के आगे के विकास की भविष्यवाणी करना संभव बनाता है।
इंस्टा फॉरेक्स द्वारा प्रासंगिक पैटर्न एक उपयोग में आसान सेवा है जो आपको बाजार में नवीनतम परिवर्तनों के बारे में जागरूक होने और समय पर बाजार से संकेतों पर प्रतिक्रिया करने की अनुमति देती है। हमारी सेवा में आप हमेशा किसी भी जोड़ी और किसी भी समय सीमा पर नवीनतम और सबसे प्रासंगिक पैटर्न प्राप्त कर सकते हैं.
Double Top
was formed on 09.04 at 05:55:06 (UTC+0)
signal strength 1 of 5
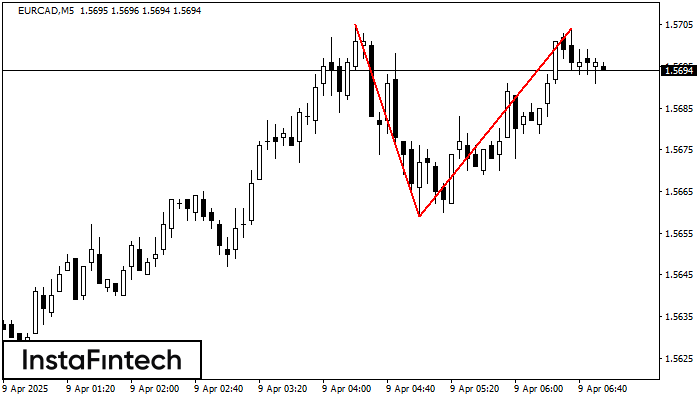
On the chart of EURCAD M5 the Double Top reversal pattern has been formed. Characteristics: the upper boundary 1.5704; the lower boundary 1.5659; the width of the pattern 45 points. The signal: a break of the lower boundary will cause continuation of the downward trend targeting the 1.5644 level.
The M5 and M15 time frames may have more false entry points.
- All
- All
- Bearish Rectangle
- Bearish Symmetrical Triangle
- Bearish Symmetrical Triangle
- Bullish Rectangle
- Double Top
- Double Top
- Triple Bottom
- Triple Bottom
- Triple Top
- Triple Top
- All
- All
- Buy
- Sale
- All
- 1
- 2
- 3
- 4
- 5
बियरिश पताका
was formed on 22.05 at 20:40:59 (UTC+0)
signal strength 4 of 5
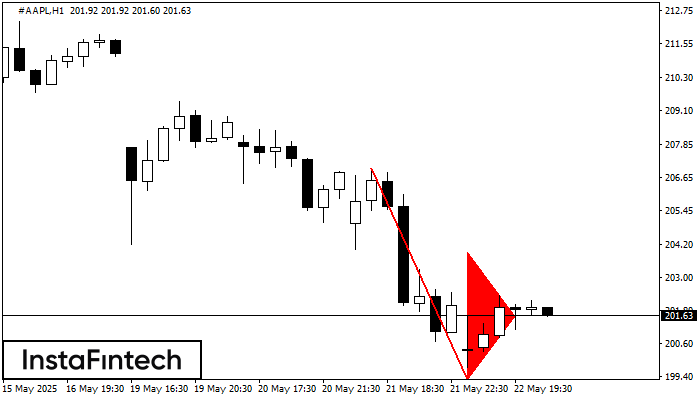
बियरिश पताका पैटर्न #AAPL H1 चार्ट पर बना है। यह मौजूदा ट्रेंड कि संभावित निरंतरता का संकेत देता है। निर्दिष्टीकरण: पैटर्न का नीचल स्तर 199.24 पर है; फ्लैगपोल की ऊंचाई
Open chart in a new window
बियरिश पताका
was formed on 22.05 at 20:40:35 (UTC+0)
signal strength 4 of 5
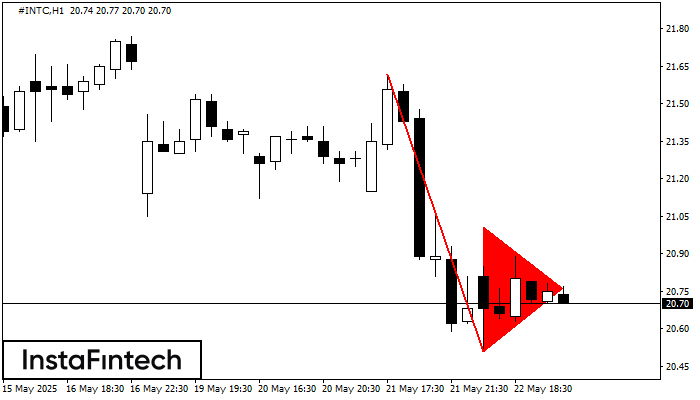
बियरिश पताका पैटर्न #INTC H1 चार्ट पर बना है। यह मौजूदा ट्रेंड कि संभावित निरंतरता का संकेत देता है। निर्दिष्टीकरण: पैटर्न का नीचल स्तर 20.51 पर है; फ्लैगपोल की ऊंचाई
Open chart in a new window
बियरिश सिमेट्रिकल त्रिभुज
was formed on 22.05 at 19:51:05 (UTC+0)
signal strength 1 of 5
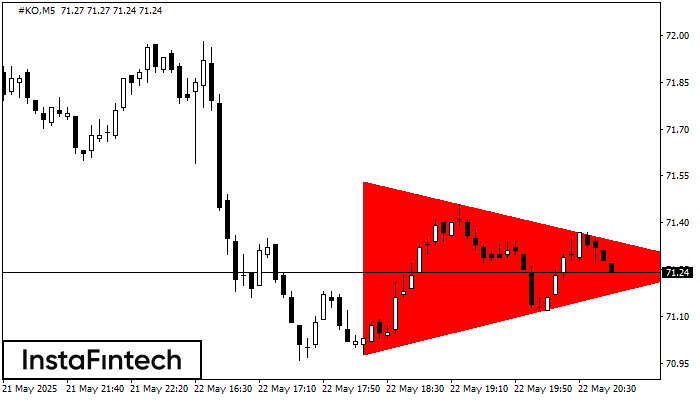
M5 के चार्ट के अनुसार, #KO से बियरिश सिमेट्रिकल त्रिभुज पैटर्न बना। ट्रेडिंग अनुशंसाएं: संभावना है की निचली सीमा 70.98 का उल्लंघन नीचे की प्रवृत्ति को जारी रखने के लिए
M5 और M15 समय सीमा में अधिक फाल्स एंट्री पॉइंट्स हो सकते हैं।
Open chart in a new window


