

वास्तविक पैटर्न

पैटर्न ग्राफिकल मॉडल हैं जो चार्ट में मूल्य से बने होते हैं। तकनीकी विश्लेषण भविष्यवाणियों में से एक के अनुसार, इतिहास का मतलब मूल्य आंदोलन खुद को दोहराता है। इसका मतलब है कि मूल्य आंदोलन अक्सर एक ही परिस्थितियों में समान होते हैं जो उच्च संभावना के साथ स्थिति के आगे के विकास की भविष्यवाणी करना संभव बनाता है।
इंस्टा फॉरेक्स द्वारा प्रासंगिक पैटर्न एक उपयोग में आसान सेवा है जो आपको बाजार में नवीनतम परिवर्तनों के बारे में जागरूक होने और समय पर बाजार से संकेतों पर प्रतिक्रिया करने की अनुमति देती है। हमारी सेवा में आप हमेशा किसी भी जोड़ी और किसी भी समय सीमा पर नवीनतम और सबसे प्रासंगिक पैटर्न प्राप्त कर सकते हैं.
Bearish Symmetrical Triangle
was formed on 07.04 at 13:37:39 (UTC+0)
signal strength 2 of 5
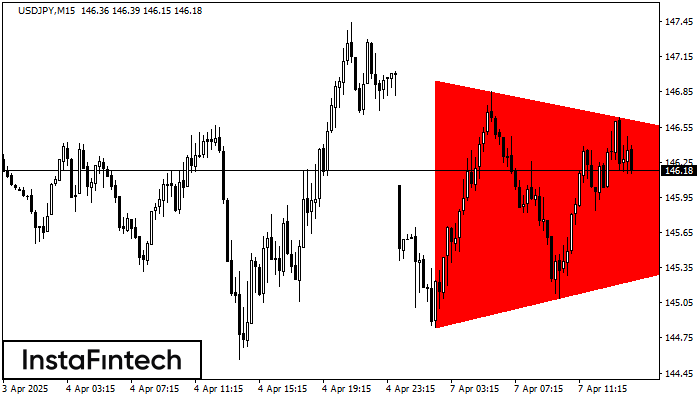
According to the chart of M15, USDJPY formed the Bearish Symmetrical Triangle pattern. Description: The lower border is 144.84/145.98 and upper border is 146.95/145.98. The pattern width is measured on the chart at -211 pips. The formation of the Bearish Symmetrical Triangle pattern evidently signals a continuation of the downward trend. In other words, if the scenario comes true and USDJPY breaches the lower border, the price could continue its move toward 145.76.
The M5 and M15 time frames may have more false entry points.
See Also
- All
- All
- Bearish Rectangle
- Bearish Symmetrical Triangle
- Bearish Symmetrical Triangle
- Bullish Rectangle
- Double Top
- Double Top
- Triple Bottom
- Triple Bottom
- Triple Top
- Triple Top
- All
- All
- Buy
- Sale
- All
- 1
- 2
- 3
- 4
- 5
Double Bottom
was formed on 30.05 at 19:05:16 (UTC+0)
signal strength 1 of 5
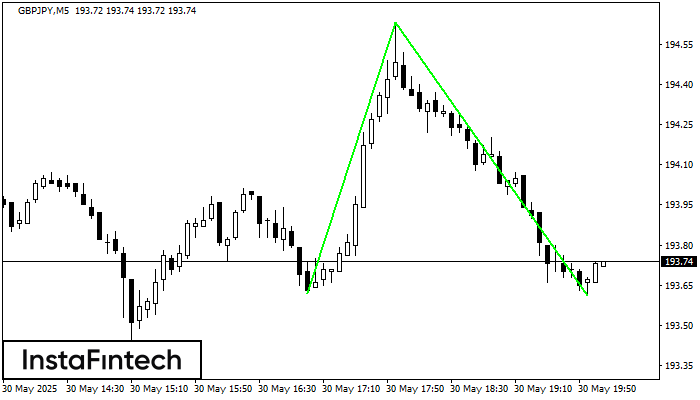
The Double Bottom pattern has been formed on GBPJPY M5; the upper boundary is 194.63; the lower boundary is 193.61. The width of the pattern is 101 points. In case
The M5 and M15 time frames may have more false entry points.
Open chart in a new window
Double Top
was formed on 30.05 at 18:30:13 (UTC+0)
signal strength 2 of 5
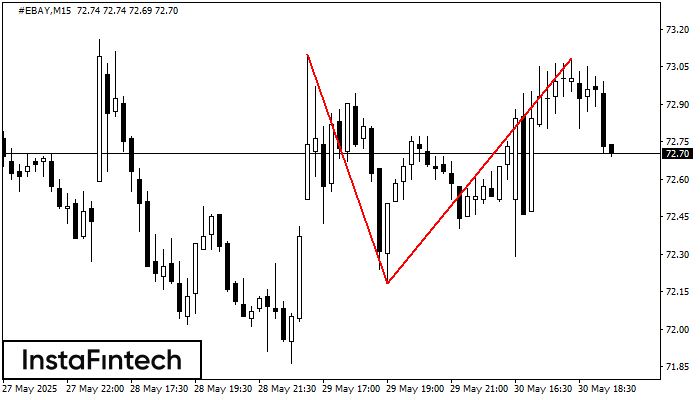
The Double Top reversal pattern has been formed on #EBAY M15. Characteristics: the upper boundary 73.10; the lower boundary 72.18; the width of the pattern is 90 points. Sell trades
The M5 and M15 time frames may have more false entry points.
Open chart in a new window
Bullish Rectangle
was formed on 30.05 at 18:25:46 (UTC+0)
signal strength 1 of 5
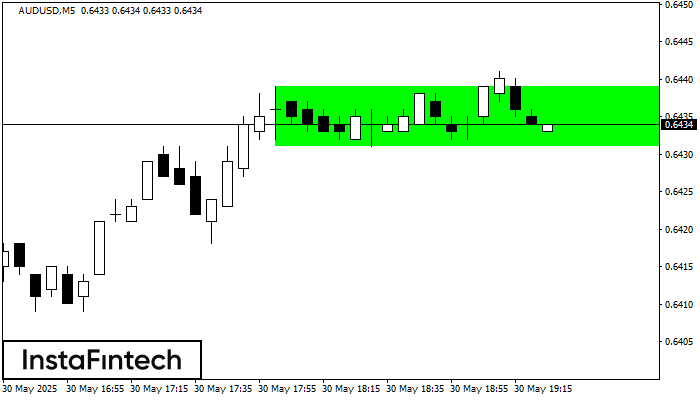
According to the chart of M5, AUDUSD formed the Bullish Rectangle. This type of a pattern indicates a trend continuation. It consists of two levels: resistance 0.6439 and support 0.6431
The M5 and M15 time frames may have more false entry points.
Open chart in a new window


