

वास्तविक पैटर्न

पैटर्न ग्राफिकल मॉडल हैं जो चार्ट में मूल्य से बने होते हैं। तकनीकी विश्लेषण भविष्यवाणियों में से एक के अनुसार, इतिहास का मतलब मूल्य आंदोलन खुद को दोहराता है। इसका मतलब है कि मूल्य आंदोलन अक्सर एक ही परिस्थितियों में समान होते हैं जो उच्च संभावना के साथ स्थिति के आगे के विकास की भविष्यवाणी करना संभव बनाता है।
इंस्टा फॉरेक्स द्वारा प्रासंगिक पैटर्न एक उपयोग में आसान सेवा है जो आपको बाजार में नवीनतम परिवर्तनों के बारे में जागरूक होने और समय पर बाजार से संकेतों पर प्रतिक्रिया करने की अनुमति देती है। हमारी सेवा में आप हमेशा किसी भी जोड़ी और किसी भी समय सीमा पर नवीनतम और सबसे प्रासंगिक पैटर्न प्राप्त कर सकते हैं.
Double Bottom
was formed on 07.04 at 13:00:00 (UTC+0)
signal strength 4 of 5
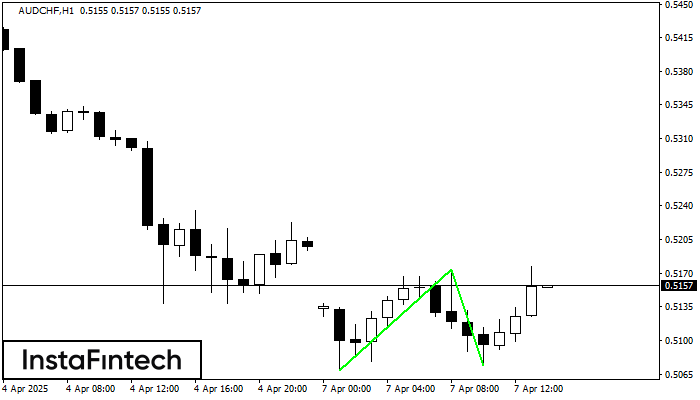
The Double Bottom pattern has been formed on AUDCHF H1; the upper boundary is 0.5174; the lower boundary is 0.5074. The width of the pattern is 105 points. In case of a break of the upper boundary 0.5174, a change in the trend can be predicted where the width of the pattern will coincide with the distance to a possible take profit level.
- All
- All
- Bearish Rectangle
- Bearish Symmetrical Triangle
- Bearish Symmetrical Triangle
- Bullish Rectangle
- Double Top
- Double Top
- Triple Bottom
- Triple Bottom
- Triple Top
- Triple Top
- All
- All
- Buy
- Sale
- All
- 1
- 2
- 3
- 4
- 5
Panji Bullish
was formed on 05.06 at 17:30:09 (UTC+0)
signal strength 2 of 5
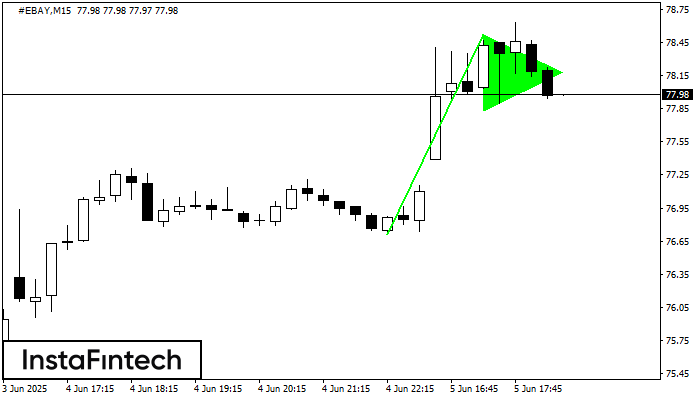
Sinyal Panji Bullish – instrumen trading #EBAY M15, pola kelanjutan. Prakiraan: mungkin untuk mengatur posisi beli di atas titik tertinggi pola, di 78.52, dengan prospek pergerakan selanjutnya menjadi proyeksi titik
Rangka waktu M5 dan M15 mungkin memiliki lebih dari titik entri yang keliru.
Open chart in a new window
Panji Bearish
was formed on 05.06 at 16:45:18 (UTC+0)
signal strength 2 of 5

Pola Panji Bearish telah terbentuk di grafik #TSLA M15. Jenis pola ini memiliki ciri sedikit perlambatan yang setelahnya harga akan bergerak ke arah tren sebenarnya. Jika harga ditetapkan di bawah
Rangka waktu M5 dan M15 mungkin memiliki lebih dari titik entri yang keliru.
Open chart in a new window
Panji Bearish
was formed on 05.06 at 16:45:10 (UTC+0)
signal strength 2 of 5
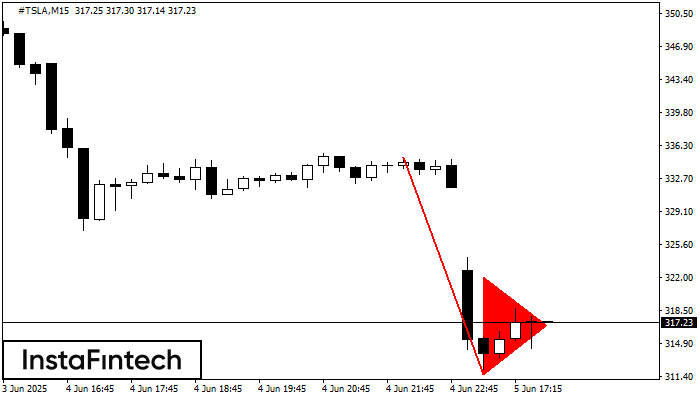
Pola Panji Bearish telah terbentuk di grafik #TSLA M15. Pola ini memberikan sinyal potensi kelanjutan tren yang ada. Spesifikasi: titik terendah pola berkoordinat di 311.59; proyeksi titik tertinggi sama dengan
Rangka waktu M5 dan M15 mungkin memiliki lebih dari titik entri yang keliru.
Open chart in a new window


