

वास्तविक पैटर्न

पैटर्न ग्राफिकल मॉडल हैं जो चार्ट में मूल्य से बने होते हैं। तकनीकी विश्लेषण भविष्यवाणियों में से एक के अनुसार, इतिहास का मतलब मूल्य आंदोलन खुद को दोहराता है। इसका मतलब है कि मूल्य आंदोलन अक्सर एक ही परिस्थितियों में समान होते हैं जो उच्च संभावना के साथ स्थिति के आगे के विकास की भविष्यवाणी करना संभव बनाता है।
इंस्टा फॉरेक्स द्वारा प्रासंगिक पैटर्न एक उपयोग में आसान सेवा है जो आपको बाजार में नवीनतम परिवर्तनों के बारे में जागरूक होने और समय पर बाजार से संकेतों पर प्रतिक्रिया करने की अनुमति देती है। हमारी सेवा में आप हमेशा किसी भी जोड़ी और किसी भी समय सीमा पर नवीनतम और सबसे प्रासंगिक पैटर्न प्राप्त कर सकते हैं.
Bearish Rectangle
was formed on 05.04 at 02:40:31 (UTC+0)
signal strength 4 of 5

According to the chart of H1, #Bitcoin formed the Bearish Rectangle. This type of a pattern indicates a trend continuation. It consists of two levels: resistance 84685.39 - 0.00 and support 81178.46 – 81178.46. In case the resistance level 81178.46 - 81178.46 is broken, the instrument is likely to follow the bearish trend.
- All
- All
- Bearish Rectangle
- Bearish Symmetrical Triangle
- Bearish Symmetrical Triangle
- Bullish Rectangle
- Double Top
- Double Top
- Triple Bottom
- Triple Bottom
- Triple Top
- Triple Top
- All
- All
- Buy
- Sale
- All
- 1
- 2
- 3
- 4
- 5
Triple Bottom
was formed on 17.04 at 02:00:07 (UTC+0)
signal strength 2 of 5

The Triple Bottom pattern has formed on the chart of the USDJPY M15 trading instrument. The pattern signals a change in the trend from downwards to upwards in the case
The M5 and M15 time frames may have more false entry points.
Open chart in a new window
Triple Bottom
was formed on 17.04 at 02:00:03 (UTC+0)
signal strength 1 of 5
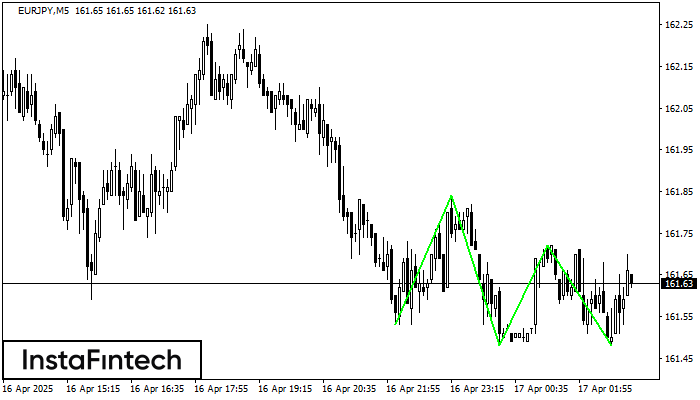
The Triple Bottom pattern has been formed on EURJPY M5. It has the following characteristics: resistance level 161.84/161.72; support level 161.53/161.48; the width is 31 points. In the event
The M5 and M15 time frames may have more false entry points.
Open chart in a new window
Double Top
was formed on 17.04 at 01:55:47 (UTC+0)
signal strength 1 of 5
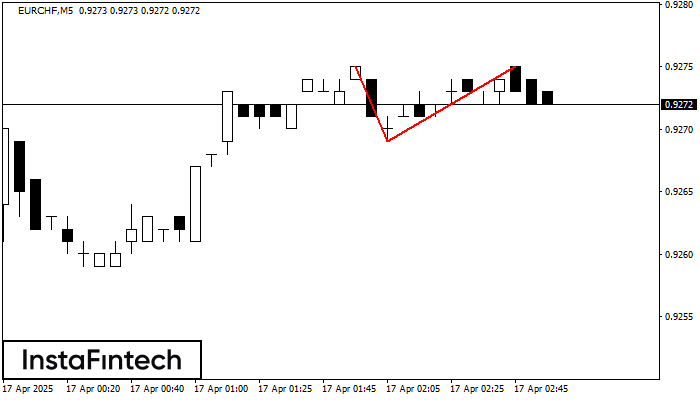
The Double Top pattern has been formed on EURCHF M5. It signals that the trend has been changed from upwards to downwards. Probably, if the base of the pattern 0.9269
The M5 and M15 time frames may have more false entry points.
Open chart in a new window


