

वास्तविक पैटर्न

पैटर्न ग्राफिकल मॉडल हैं जो चार्ट में मूल्य से बने होते हैं। तकनीकी विश्लेषण भविष्यवाणियों में से एक के अनुसार, इतिहास का मतलब मूल्य आंदोलन खुद को दोहराता है। इसका मतलब है कि मूल्य आंदोलन अक्सर एक ही परिस्थितियों में समान होते हैं जो उच्च संभावना के साथ स्थिति के आगे के विकास की भविष्यवाणी करना संभव बनाता है।
इंस्टा फॉरेक्स द्वारा प्रासंगिक पैटर्न एक उपयोग में आसान सेवा है जो आपको बाजार में नवीनतम परिवर्तनों के बारे में जागरूक होने और समय पर बाजार से संकेतों पर प्रतिक्रिया करने की अनुमति देती है। हमारी सेवा में आप हमेशा किसी भी जोड़ी और किसी भी समय सीमा पर नवीनतम और सबसे प्रासंगिक पैटर्न प्राप्त कर सकते हैं.
Triple Top
was formed on 03.04 at 06:30:35 (UTC+0)
signal strength 1 of 5
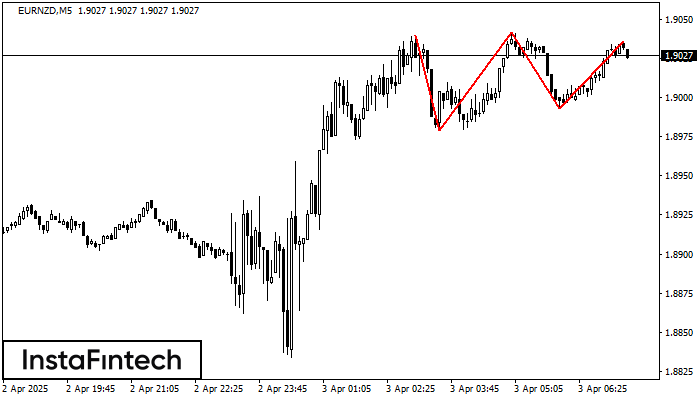
The Triple Top pattern has formed on the chart of the EURNZD M5 trading instrument. It is a reversal pattern featuring the following characteristics: resistance level 4, support level -14, and pattern’s width 61. Forecast If the price breaks through the support level 1.8979, it is likely to move further down to 1.9027.
The M5 and M15 time frames may have more false entry points.
- All
- All
- Bearish Rectangle
- Bearish Symmetrical Triangle
- Bearish Symmetrical Triangle
- Bullish Rectangle
- Double Top
- Double Top
- Triple Bottom
- Triple Bottom
- Triple Top
- Triple Top
- All
- All
- Buy
- Sale
- All
- 1
- 2
- 3
- 4
- 5
Bullish Symmetrical Triangle
was formed on 24.05 at 18:46:25 (UTC+0)
signal strength 2 of 5

According to the chart of M15, #Bitcoin formed the Bullish Symmetrical Triangle pattern, which signals the trend will continue. Description. The upper border of the pattern touches the coordinates 109440.14/108872.57
The M5 and M15 time frames may have more false entry points.
Open chart in a new window
Bearish Rectangle
was formed on 23.05 at 23:00:20 (UTC+0)
signal strength 1 of 5

According to the chart of M5, EURNZD formed the Bearish Rectangle. The pattern indicates a trend continuation. The upper border is 1.8982, the lower border is 1.8964. The signal means
The M5 and M15 time frames may have more false entry points.
Open chart in a new window
Bullish Symmetrical Triangle
was formed on 23.05 at 22:14:53 (UTC+0)
signal strength 1 of 5

According to the chart of M5, AUDCHF formed the Bullish Symmetrical Triangle pattern. Description: This is the pattern of a trend continuation. 0.5335 and 0.5329 are the coordinates
The M5 and M15 time frames may have more false entry points.
Open chart in a new window


