

वास्तविक पैटर्न

पैटर्न ग्राफिकल मॉडल हैं जो चार्ट में मूल्य से बने होते हैं। तकनीकी विश्लेषण भविष्यवाणियों में से एक के अनुसार, इतिहास का मतलब मूल्य आंदोलन खुद को दोहराता है। इसका मतलब है कि मूल्य आंदोलन अक्सर एक ही परिस्थितियों में समान होते हैं जो उच्च संभावना के साथ स्थिति के आगे के विकास की भविष्यवाणी करना संभव बनाता है।
इंस्टा फॉरेक्स द्वारा प्रासंगिक पैटर्न एक उपयोग में आसान सेवा है जो आपको बाजार में नवीनतम परिवर्तनों के बारे में जागरूक होने और समय पर बाजार से संकेतों पर प्रतिक्रिया करने की अनुमति देती है। हमारी सेवा में आप हमेशा किसी भी जोड़ी और किसी भी समय सीमा पर नवीनतम और सबसे प्रासंगिक पैटर्न प्राप्त कर सकते हैं.
Triple Bottom
was formed on 02.04 at 12:00:59 (UTC+0)
signal strength 4 of 5
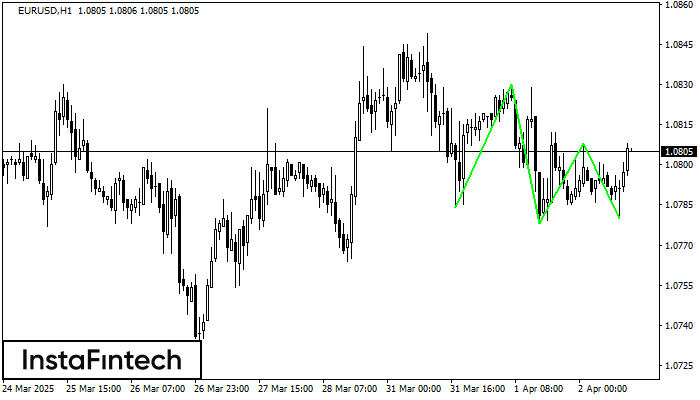
The Triple Bottom pattern has been formed on EURUSD H1. It has the following characteristics: resistance level 1.0830/1.0808; support level 1.0784/1.0780; the width is 46 points. In the event of a breakdown of the resistance level of 1.0830, the price is likely to continue an upward movement at least to 1.0818.
- All
- All
- Bearish Rectangle
- Bearish Symmetrical Triangle
- Bearish Symmetrical Triangle
- Bullish Rectangle
- Double Top
- Double Top
- Triple Bottom
- Triple Bottom
- Triple Top
- Triple Top
- All
- All
- Buy
- Sale
- All
- 1
- 2
- 3
- 4
- 5
Double Bottom
was formed on 26.05 at 01:50:33 (UTC+0)
signal strength 1 of 5
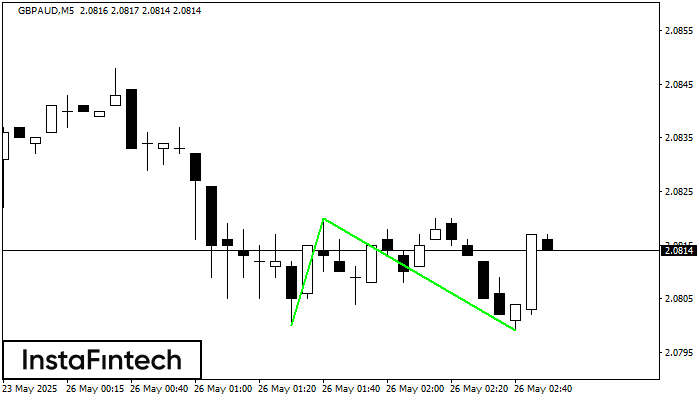
The Double Bottom pattern has been formed on GBPAUD M5. Characteristics: the support level 2.0800; the resistance level 2.0820; the width of the pattern 20 points. If the resistance level
The M5 and M15 time frames may have more false entry points.
Open chart in a new window
Bullish Symmetrical Triangle
was formed on 26.05 at 01:45:28 (UTC+0)
signal strength 1 of 5
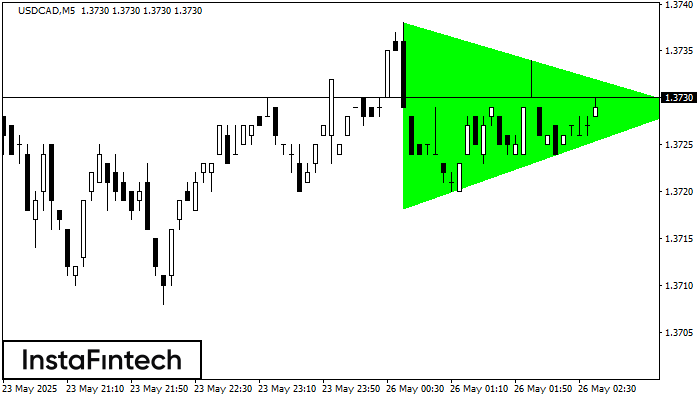
According to the chart of M5, USDCAD formed the Bullish Symmetrical Triangle pattern. The lower border of the pattern touches the coordinates 1.3718/1.3729 whereas the upper border goes across 1.3738/1.3729
The M5 and M15 time frames may have more false entry points.
Open chart in a new window
Bullish Flag
was formed on 26.05 at 01:42:07 (UTC+0)
signal strength 2 of 5
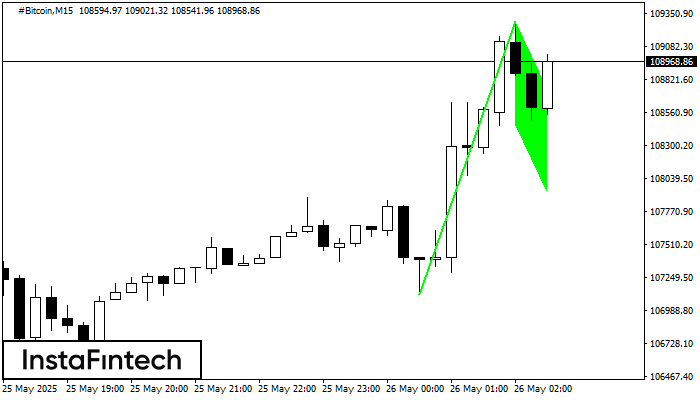
The Bullish Flag pattern has been formed on the chart #Bitcoin M15 which signals that the upward trend will continue. Signals: а break of the peak at 109285.25 may push
The M5 and M15 time frames may have more false entry points.
Open chart in a new window


