

वास्तविक पैटर्न

पैटर्न ग्राफिकल मॉडल हैं जो चार्ट में मूल्य से बने होते हैं। तकनीकी विश्लेषण भविष्यवाणियों में से एक के अनुसार, इतिहास का मतलब मूल्य आंदोलन खुद को दोहराता है। इसका मतलब है कि मूल्य आंदोलन अक्सर एक ही परिस्थितियों में समान होते हैं जो उच्च संभावना के साथ स्थिति के आगे के विकास की भविष्यवाणी करना संभव बनाता है।
इंस्टा फॉरेक्स द्वारा प्रासंगिक पैटर्न एक उपयोग में आसान सेवा है जो आपको बाजार में नवीनतम परिवर्तनों के बारे में जागरूक होने और समय पर बाजार से संकेतों पर प्रतिक्रिया करने की अनुमति देती है। हमारी सेवा में आप हमेशा किसी भी जोड़ी और किसी भी समय सीमा पर नवीनतम और सबसे प्रासंगिक पैटर्न प्राप्त कर सकते हैं.
Double Bottom
was formed on 02.04 at 11:00:06 (UTC+0)
signal strength 4 of 5
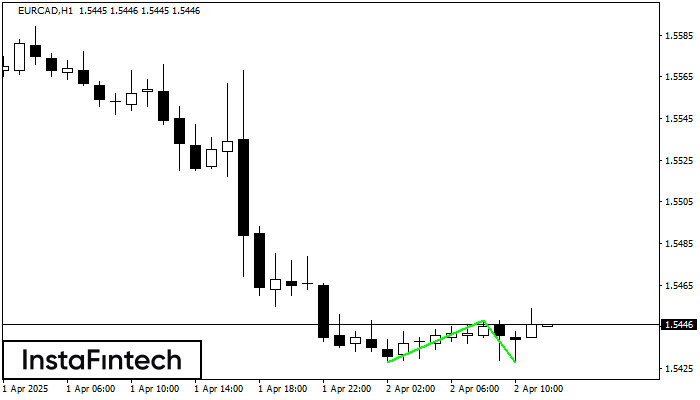
The Double Bottom pattern has been formed on EURCAD H1; the upper boundary is 1.5448; the lower boundary is 1.5428. The width of the pattern is 20 points. In case of a break of the upper boundary 1.5448, a change in the trend can be predicted where the width of the pattern will coincide with the distance to a possible take profit level.
- All
- All
- Bearish Rectangle
- Bearish Symmetrical Triangle
- Bearish Symmetrical Triangle
- Bullish Rectangle
- Double Top
- Double Top
- Triple Bottom
- Triple Bottom
- Triple Top
- Triple Top
- All
- All
- Buy
- Sale
- All
- 1
- 2
- 3
- 4
- 5
Bawah Ganda
was formed on 30.05 at 12:31:28 (UTC+0)
signal strength 3 of 5
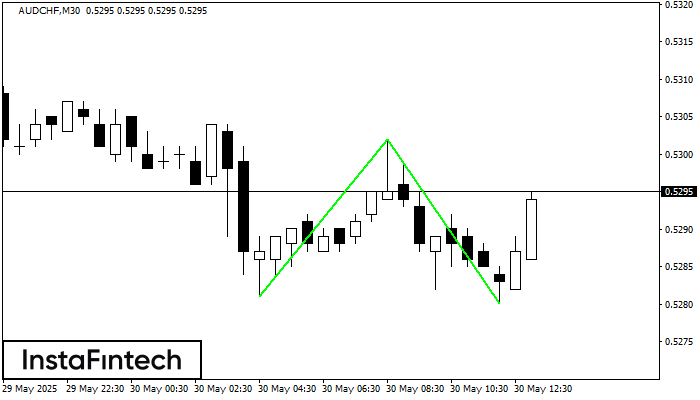
Pola Bawah Ganda telah terbentuk pada AUDCHF M30. Karakteristik: level support 0.5281; level resistance 0.5302; lebar pola 21 poin. Jika level resistance ditembus, perubahan dalam tren dapat diprediksi dengan target
Open chart in a new window
Bawah Ganda
was formed on 30.05 at 12:00:29 (UTC+0)
signal strength 2 of 5
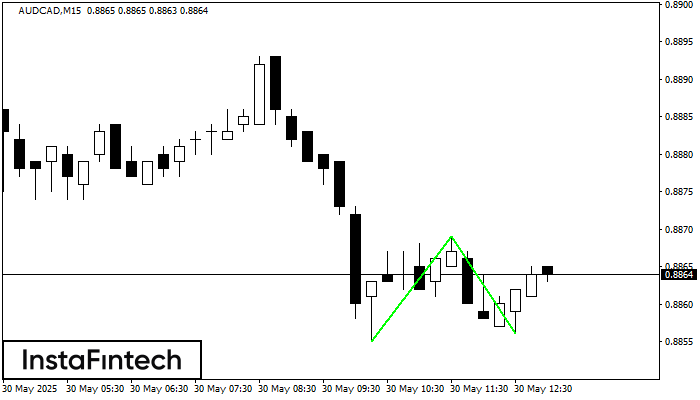
Pola Bawah Ganda telah terbentuk pada AUDCAD M15; batas atas di 0.8869; batas bawah di 0.8856. Lebar pola sebesar 14 poin. Jika harga menembus batas atas 0.8869, Perubahan dalam tren
Rangka waktu M5 dan M15 mungkin memiliki lebih dari titik entri yang keliru.
Open chart in a new window
Bawah Triple
was formed on 30.05 at 11:36:39 (UTC+0)
signal strength 1 of 5
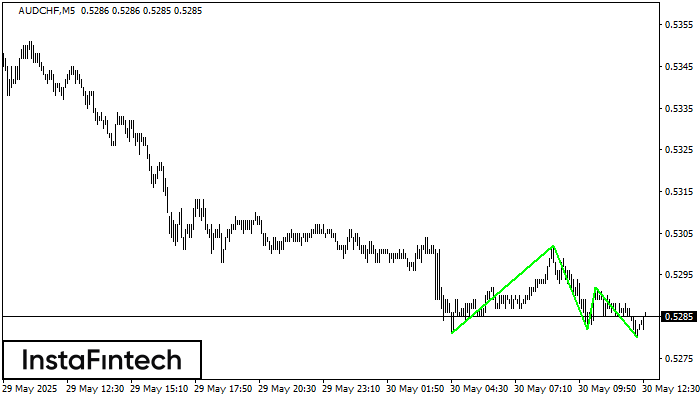
Pola Bawah Triple telah terbentuk pada grafik AUDCHF M5. Fitur-fitur pola: garis bawah pola memiliki koordinat 0.5302 dengan batas atas 0.5302/0.5292, proyeksi lebar adalah 21 poin. Pembentukan pola Bawah Triple
Rangka waktu M5 dan M15 mungkin memiliki lebih dari titik entri yang keliru.
Open chart in a new window


