

वास्तविक पैटर्न

पैटर्न ग्राफिकल मॉडल हैं जो चार्ट में मूल्य से बने होते हैं। तकनीकी विश्लेषण भविष्यवाणियों में से एक के अनुसार, इतिहास का मतलब मूल्य आंदोलन खुद को दोहराता है। इसका मतलब है कि मूल्य आंदोलन अक्सर एक ही परिस्थितियों में समान होते हैं जो उच्च संभावना के साथ स्थिति के आगे के विकास की भविष्यवाणी करना संभव बनाता है।
इंस्टा फॉरेक्स द्वारा प्रासंगिक पैटर्न एक उपयोग में आसान सेवा है जो आपको बाजार में नवीनतम परिवर्तनों के बारे में जागरूक होने और समय पर बाजार से संकेतों पर प्रतिक्रिया करने की अनुमति देती है। हमारी सेवा में आप हमेशा किसी भी जोड़ी और किसी भी समय सीमा पर नवीनतम और सबसे प्रासंगिक पैटर्न प्राप्त कर सकते हैं.
Bullish Rectangle
was formed on 02.04 at 02:16:17 (UTC+0)
signal strength 1 of 5
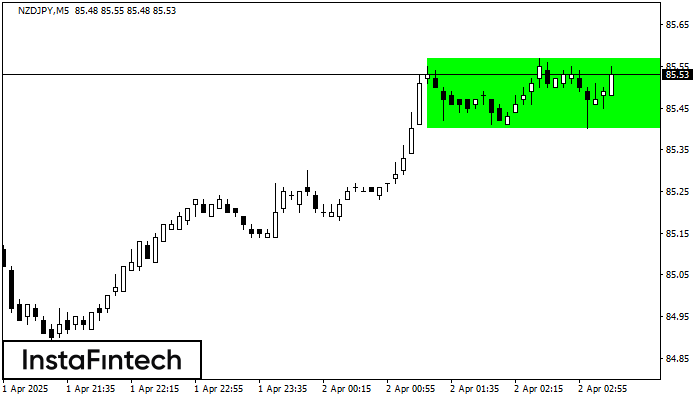
According to the chart of M5, NZDJPY formed the Bullish Rectangle which is a pattern of a trend continuation. The pattern is contained within the following borders: the lower border 85.40 – 85.40 and upper border 85.57 – 85.57. In case the upper border is broken, the instrument is likely to follow the upward trend.
The M5 and M15 time frames may have more false entry points.
- All
- All
- Bearish Rectangle
- Bearish Symmetrical Triangle
- Bearish Symmetrical Triangle
- Bullish Rectangle
- Double Top
- Double Top
- Triple Bottom
- Triple Bottom
- Triple Top
- Triple Top
- All
- All
- Buy
- Sale
- All
- 1
- 2
- 3
- 4
- 5
Head and Shoulders
was formed on 21.04 at 17:29:51 (UTC+0)
signal strength 3 of 5
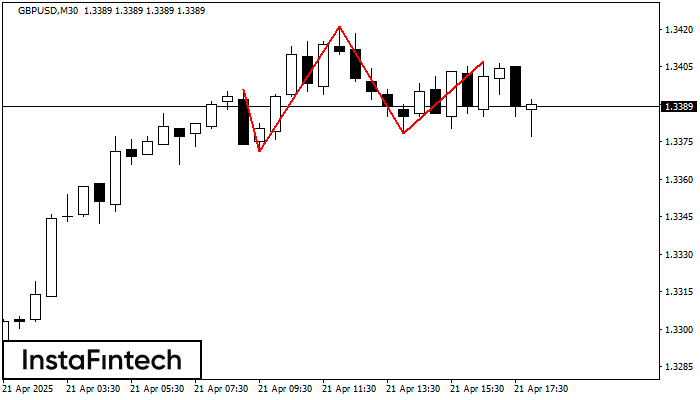
According to the chart of M30, GBPUSD formed the Head and Shoulders pattern. The Head’s top is set at 1.3421 while the median line of the Neck is found
Open chart in a new window
Inverse Head and Shoulder
was formed on 15.04 at 20:00:17 (UTC+0)
signal strength 3 of 5

According to the chart of M30, EURCHF formed the Inverse Head and Shoulder pattern. The Head’s top is set at 0.9269 while the median line of the Neck is found
Open chart in a new window
Inverse Head and Shoulder
was formed on 11.04 at 15:59:57 (UTC+0)
signal strength 3 of 5

According to the chart of M30, AUDCHF produced the pattern termed the Inverse Head and Shoulder. The Head is fixed at 0.5043 while the median line of the Neck
Open chart in a new window


